. 2002 Dec 1;22(23):10434-48.
doi: 10.1523/JNEUROSCI.22-23-10434.2002.

Energy integration describes sound-intensity coding in an insect auditory system

Affiliations

Energy integration describes sound-intensity coding in an insect auditory system

Tim Gollisch et al. J Neurosci. .

Abstract

We investigate the transduction of sound stimuli into neural responses and focus on locust auditory receptor cells. As in other mechanosensory model systems, these neurons integrate acoustic inputs over a fairly broad frequency range. To test three alternative hypotheses about the nature of this spectral integration (amplitude, energy, pressure), we perform intracellular recordings while stimulating with superpositions of pure tones. On the basis of online data analysis and automatic feedback to the stimulus generator, we systematically explore regions in stimulus space that lead to the same level of neural activity. Focusing on such iso-firing-rate regions allows for a rigorous quantitative comparison of the electrophysiological data with predictions from the three hypotheses that is independent of nonlinearities induced by the spike dynamics. We find that the dependence of the firing rates of the receptors on the composition of the frequency spectrum can be well described by an energy-integrator model. This result holds at stimulus onset as well as for the steady-state response, including the case in which adaptation effects depend on the stimulus spectrum. Predictions of the model for the responses to bandpass-filtered noise stimuli are verified accurately. Together, our data suggest that the sound-intensity coding of the receptors can be understood as a three-step process, composed of a linear filter, a summation of the energy contributions in the frequency domain, and a firing-rate encoding of the resulting effective sound intensity. These findings set quantitative constraints for future biophysical models.


Figures
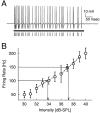
Fig. 1.
Fig. 1.
Determination of sound intensities corresponding to given firing rates. A, Example of a spike train recorded intracellularly from an axon of a receptor cell. Calibration is given to the right. The thick bar below the voltage trace denotes the 500 msec pure-tone stimulus. The vertical bars below show the spike times as determined by the spike-detection algorithm. The firing rate is calculated by counting the spikes and averaging over several stimulus repetitions.B, Example of the rising part of a rate-intensity function (○) measured in steps of 1 dB. Each stimulus was repeated multiple times. Vertical bars denote the SD of each measurement. Linear fits through the four points closest to the firing rates of interest, here 100 and 150 Hz, are depicted as dotted anddashed lines, respectively. The arrows indicate the readout of the corresponding intensities.
Fig. 2.
Fig. 2.
Prediction of iso-firing-rate curves for the superposition of two pure tones. Depending on the model, the effective sound intensity J as well as the firing rate are expected to be constant along different curves in the two-dimensional space of amplitude combinations. A1 and A2 denote the amplitudes of the respective components. According to the amplitude hypothesis (AH), iso-firing-rate curves are straight lines (one example shown by the dashed line); according to the energy hypothesis (EH), they are ellipses (solid line); and according to the pressure hypothesis (PH), they are even more strongly bent curves (dash–dotted line), the exact shape of which has to be determined numerically. The scale of the axes is given by the filter constants C1 and C2. Note that when the hypotheses are fitted to the data, the obtained filter constants will in general be different for each model, and the intersection points with the axes will not coincide because C1 and C2 are free parameters for each model. The gray arrows indicate equally spaced directions along which the rate-intensity curves are measured. In each direction, the intensity increases with increasing amplitudes A1 and A2, whereas A1/A2 is kept fixed and determined by the angle α. (One example for this angle is denoted in the figure.) The intersection points of thearrows with the iso-firing-rate curves denote the amplitude combinations that are expected to yield the specified firing rate according to each of the three alternative hypotheses. Because the three intersection points on each gray arrow clearly differ from each other, the measurements of the iso-firing-rate curves can be used to distinguish between the hypotheses.
Fig. 3.
Fig. 3.
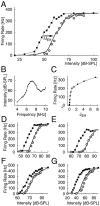
Firing-rate responses of a locust auditory receptor cell. A, Rate-intensity function for a 7 kHz pure tone. The observed sigmoidal shape of the rate-intensity function is typical for many receptor types. Below a threshold of ∼45 dB SPL, the cell shows virtually no response.B, Rate-intensity functions of the same neuron for many different pure tones between 1.25 and 28 kHz. Connected points belong to the same sound frequency. Curvesfarther to the left correspond to frequencies at which the cell is more sensitive. Although there are large differences concerning the intensity range where the individual rate-intensity functions rise from threshold to saturation, their overall shape is very similar. For example, all measured rate-intensity functions have approximately the same slope in the rising part of the curves and saturate at around the same level. C, The same rate-intensity functions as inB, now shifted along the decibel axis such that they align at a firing rate of 250 Hz. This demonstrates the generic shape of the rate-intensity functions. D, Curves denoting equal firing rates at different sound intensities for the same cell. The threshold curve (solid line) and the intensities corresponding to constant firing rates of 150 Hz (dashed line) and 300 Hz (dotted line) are shown for pure tones between 1.25 and 28 kHz. The three curves are approximately parallel to each other, reflecting the similarity of the rate-intensity functions for different frequencies.
Fig. 4.
Fig. 4.
Iso-firing-rate curves for superpositions of two pure tones for four different receptor cells (A–D). The measured pairs of amplitudes corresponding to a firing rate of 150 Hz (small filled circles) are shown together with the iso-firing-rate curves for the three hypotheses. For each curve, the two free parameters C1 and C2 were fitted to the data. The dashed lines denote the fits of the amplitude hypothesis, the solid lines denote the fits of the energy hypothesis, and the dash-dotted lines denote the fits of the pressure hypothesis. Although the curves for the amplitude and the pressure hypothesis deviate systematically, the ellipse obtained from the energy hypothesis corresponds well with the data. Note the different scales on the axes between the four cells as well as between the x -axis and the y -axis of individual plots. These differences are attributable to the strong dependence of the sensitivity on the sound frequency and the specific cell. From the fits of the energy hypothesis, we obtain the following ratios C1/C2 in these four cases: 0.33 (A), 28.33 (B), 0.39 (C), and 7.96 (D). Although there is an almost 30-fold difference (corresponding to ∼30 dB) between the amplitudes of the two tones in B, they contribute equally to the firing rate of the neuron. Also note that inA the amplitudes of the pure tones giving a firing rate of 150 Hz were measured twice (at the beginning and the end of the experiment), with the results approximately coinciding.
Fig. 5.
Fig. 5.
Iso-firing-rate curves for superpositions of two pure tones for one receptor cell at different firing rates. Thepoints display measured pairs of amplitudes, and thesolid lines are corresponding ellipses fitted to the data in accordance with the energy hypothesis. The firing rates rise from 100 to 200 Hz in steps of 25 Hz. Note that the fits agree with the data regardless of the firing rate and that ellipses for different firing rates are scaled versions of each other as predicted by the energy hypothesis. The ratios of C1/C2 lie in the narrow range between 0.177 and 0.185 for all five firing rates.
Fig. 6.
Fig. 6.
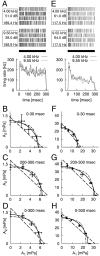
Responses and iso-firing-rate curves for two cells with stimuli of 300 msec. Each of the two columns(A–D and E–H, respectively) depicts results from a single cell. A and E show four typical spike trains in response to pure tones with frequencies f1 = 4.00 kHz (top) and f2 = 9.55 kHz (middle) as well as the corresponding instantaneous firing rates (bottom). The sound frequency in kilohertz and the intensity in decibels of the stimulus as well as the elicited firing rate in hertz are indicated in the boxes to theleft of the spike trains. The sound intensities for which the responses are shown were chosen such that the average firing rates approximately coincided for the two sound frequencies. The duration of the stimuli is denoted by the thick bars. The instantaneous firing rates were calculated by averaging over the inverse interspike intervals at each point in time and subsequently smoothed with a Gaussian of 2 msec SD. One observes a strong transient in the first 30–100 msec. In addition, the cell depicted in E–Hexhibited a slightly reduced firing rate in the first few milliseconds for the 4 kHz tone compared with the 9.55 kHz tone. B–D andF–H show iso-firing-rate data and fits of the three hypotheses for the two cells obtained from different episodes of the responses. The time window used for the analysis is denoted in each of the panels. B and F capture the onset response of the first 30 msec. C and G refer to the steady state, and D and H refer to the total response. The ellipses corresponding to the energy hypothesis (solid lines) lead to notedly better fits of the data than the curves for the amplitude hypothesis (dashed lines) and the pressure hypothesis (dash-dotted lines), regardless of the analyzed response window. For the cell illustrated in theright column, the ellipse for the onset response (F) has a half-axes ratio, RO = 0.63, that differs by ∼25% from that for the steady state (G), RS = 0.84, and by ∼15% from that for the total response (H), Rtotal = 0.74. On the other hand, the half-axes ratios for the cell in the left column vary by <5% (RO = 4.51, RS= 4.55, and Rtotal = 4.36).
Fig. 7.
Fig. 7.
Iso-firing-rate surface for superpositions of three pure tones for one receptor cell. Amplitude triplets resulting in a firing rate of 150 Hz are shown as filled circles. The three-dimensional mesh displays an ellipsoid with the three half-axes fitted to the data and illustrates the prediction for the iso-firing-rate surface from the energy hypothesis. The filter constants obtained from the fit are C1 = 0.172 Pa, C2 = 0.186 Pa, and C3 = 1.88 Pa. For optical guidance, the measured points are connected to the origin of the coordinate system bydotted lines. The intersection points of these lines with the ellipsoid are portrayed by open circles on the ellipsoid. For clarity, the iso-firing-rate surfaces corresponding to the amplitude and pressure hypotheses are not shown.
Fig. 8.
Fig. 8.
Comparison of the predictions for a noise-signal rate-intensity function with the actual measurement.A, Predicted and measured rate-intensity functions. Thesquares connected by the dotted line depict a rate-intensity function for a 4 kHz tone measured for one receptor cell. Using the energy hypothesis and the measured filter constants Cn, a prediction for the rate-intensity function of a noise signal (bandpass filtered between 5 and 10 kHz) is derived (solid line). It is obtained by shifting the pure-tone rate-intensity function by an intensity ΔIEH = 12.1 dB as indicated by thearrow. The measured firing rate of the receptor cell in response to the noise signal is shown by the circles. Data and model prediction agree well in both the overall shape of the rate-intensity function and the location on the intensity axis. The true shift between the measured rate-intensity function is estimated as ΔItrue = 12.6 dB. B, Determination of filter constants. The filled circles depict the measured intensities for pure tones between 4 and 10 kHz that led to a firing rate of 260 Hz in each case. These data were used to determine the filter constants Cn for the 4 kHz pure tone as well as for the range from 5 to 10 kHz. Further filter constants in this range were obtained by linear interpolation of this curve. C, The response function r(JEH) as determined by the rate-intensity function for the 4 kHz tone. The same firing rates that result in the squares in A are plotted against the effective sound intensity JEH of the energy hypothesis. JEH is given by ½ · A2/C2, where A denotes the amplitude of the pure tone and C denotes the filter constant, which is determined by the intensity of the pure tone that drives the cell at 260 Hz. Although the pure-tone rate-intensity function displayed in A has a large nearly linear section from ∼40 to 60 dB SPL, the response function r(JEH) is clearly nonlinear in the corresponding region (from JEH = 0.08 to JEH = 8) and resembles a square-root function. D–G , Predicted and measured rate-intensity functions for the noise signal from four other cells.Symbols are used as in A. Note the different scales on the axes. Accordingly, the slopes of the rate-intensity functions differ considerably from cell to cell, but for a single cell, they are almost identical for pure-tone and noise stimulation. The values for ΔIEH and ΔItrue in these four cases are D, ΔIEH = 9.0 dB, ΔItrue = 9.8 dB, E, ΔIEH = 12.1 dB, ΔItrue = 11.8 dB, F, ΔIEH = 7.8 dB, ΔItrue = 6.6 dB, G, ΔIEH = 14.9 dB, ΔItrue = 18.4 dB.

Similar articles

Cited by

References

    1. Adam J, Myat A, Le Roux I, Eddison M, Henrique D, Ish-Horowicz D, Lewis J. Cell fate choices and the expression of Notch, Delta and Serrate homologues in the chick inner ear: parallels with Drosophila sense-organ development. Development. 1998;125:4645–4654. - PubMed
    1. Barlow R. Statistics. Wiley; New York: 1989.
    1. Benda J. PhD thesis. Humboldt University Berlin; 2002. Single neuron dynamics—models linking theory and experiment.
    1. Benda J, Bethge M, Hennig M, Pawelzik K, Herz AVM. Spike-frequency adaptation: phenomenological model and experimental tests. Neurocomputing. 2001;38–40:105–110.
    1. Bermingham NA, Hassan BA, Price SD, Vollrath MA, Ben-Arie N, Eatock RA, Bellen HJ, Lysakowski A. Math1: an essential gene for the generation of inner hair cells. Science. 1999;284:1837–1841. - PubMed

Publication types