. 2002 Dec 1;22(23):10461-9.
doi: 10.1523/JNEUROSCI.22-23-10461.2002.

Resetting intrinsic purinergic modulation of neural activity: an associative mechanism?

Affiliations

Resetting intrinsic purinergic modulation of neural activity: an associative mechanism?

Nicholas Dale. J Neurosci. .

Abstract

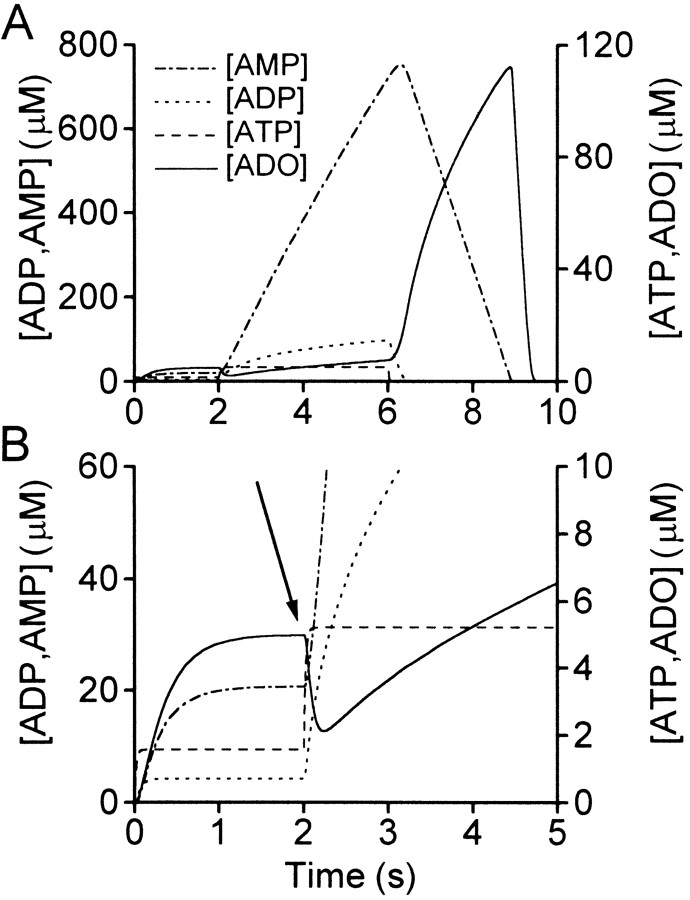
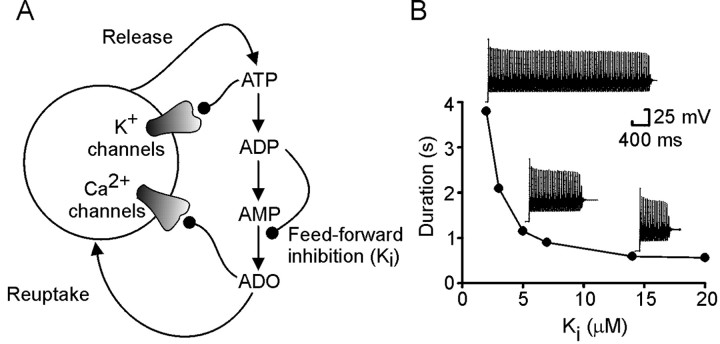
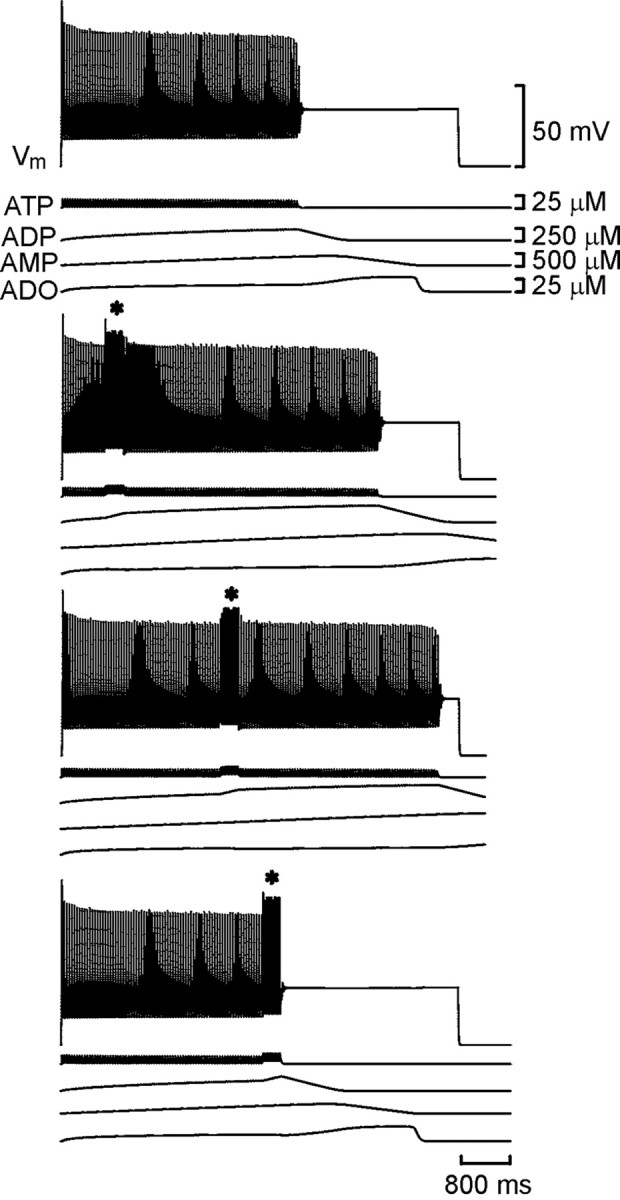
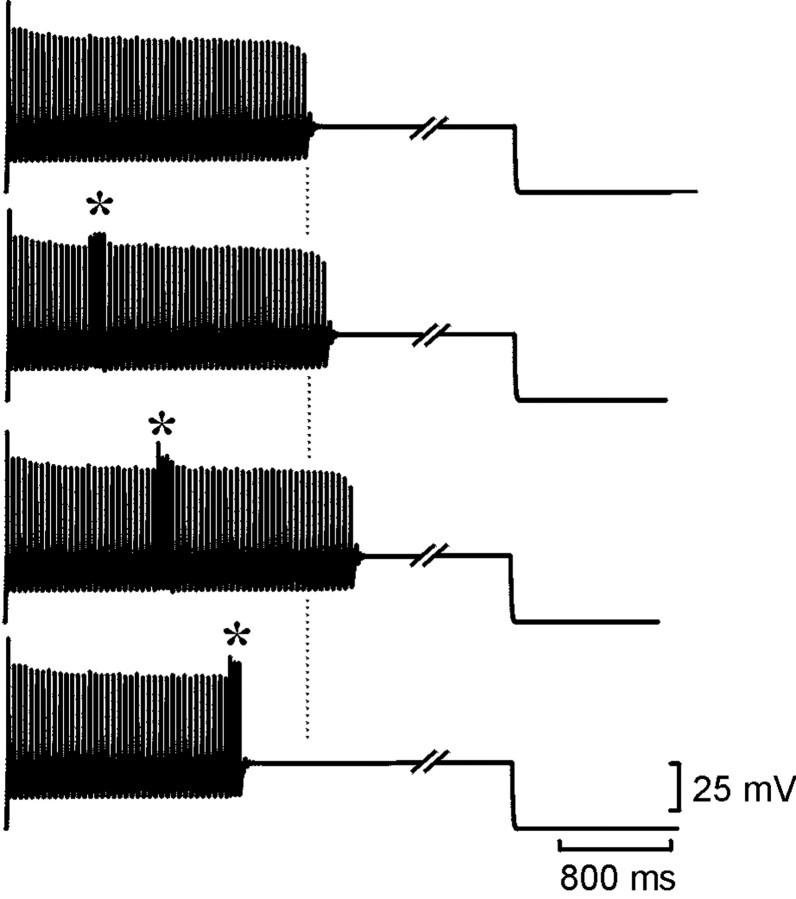
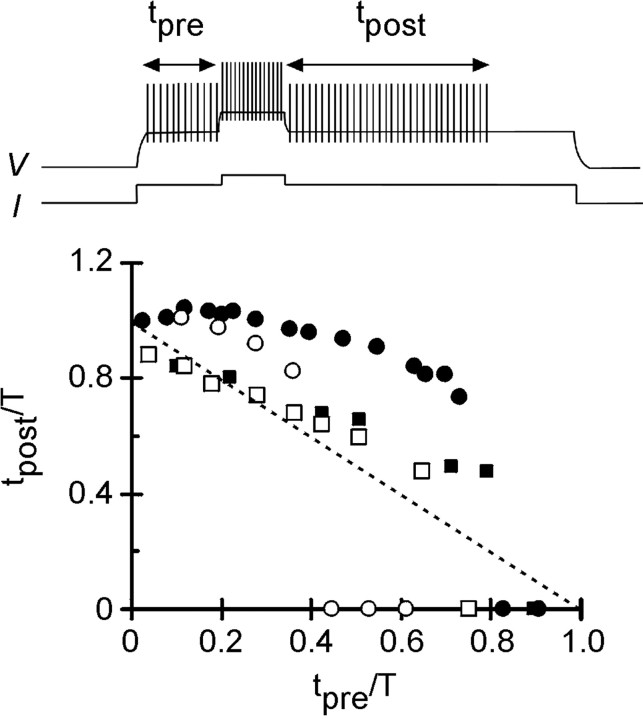
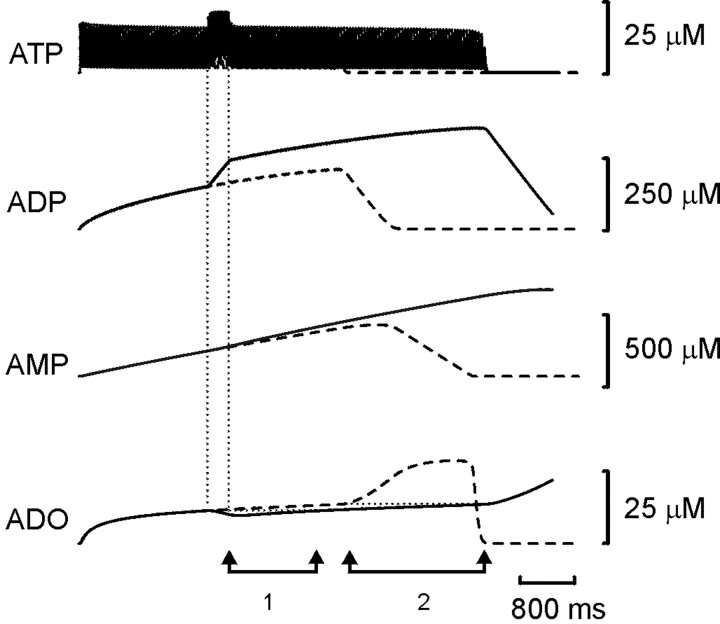
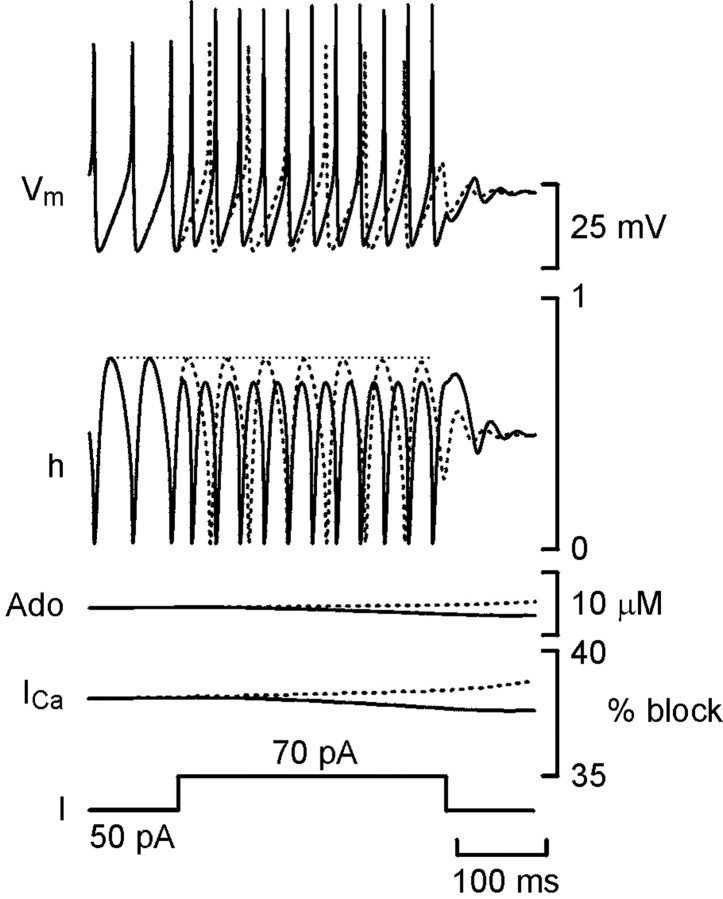
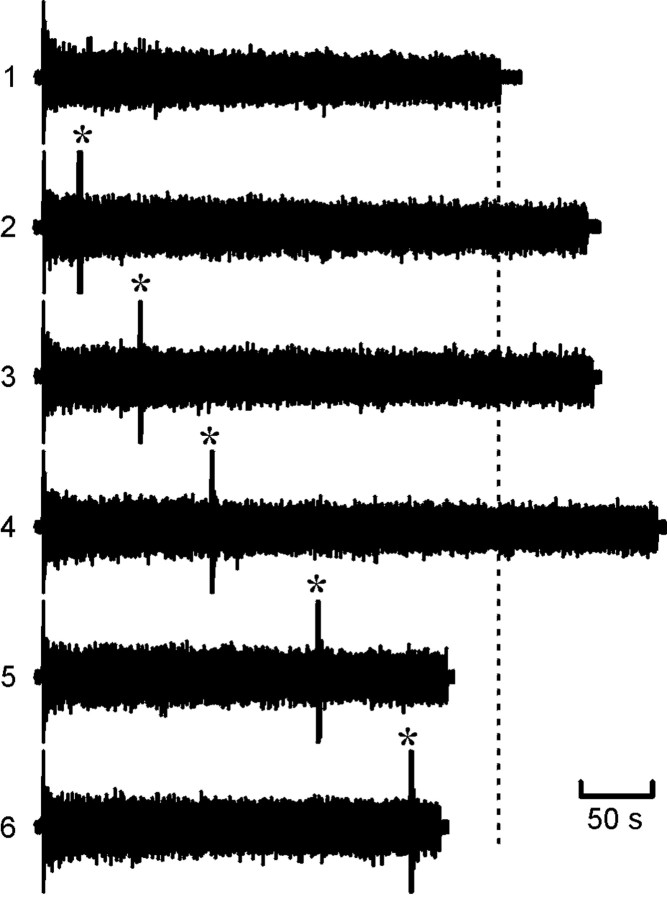
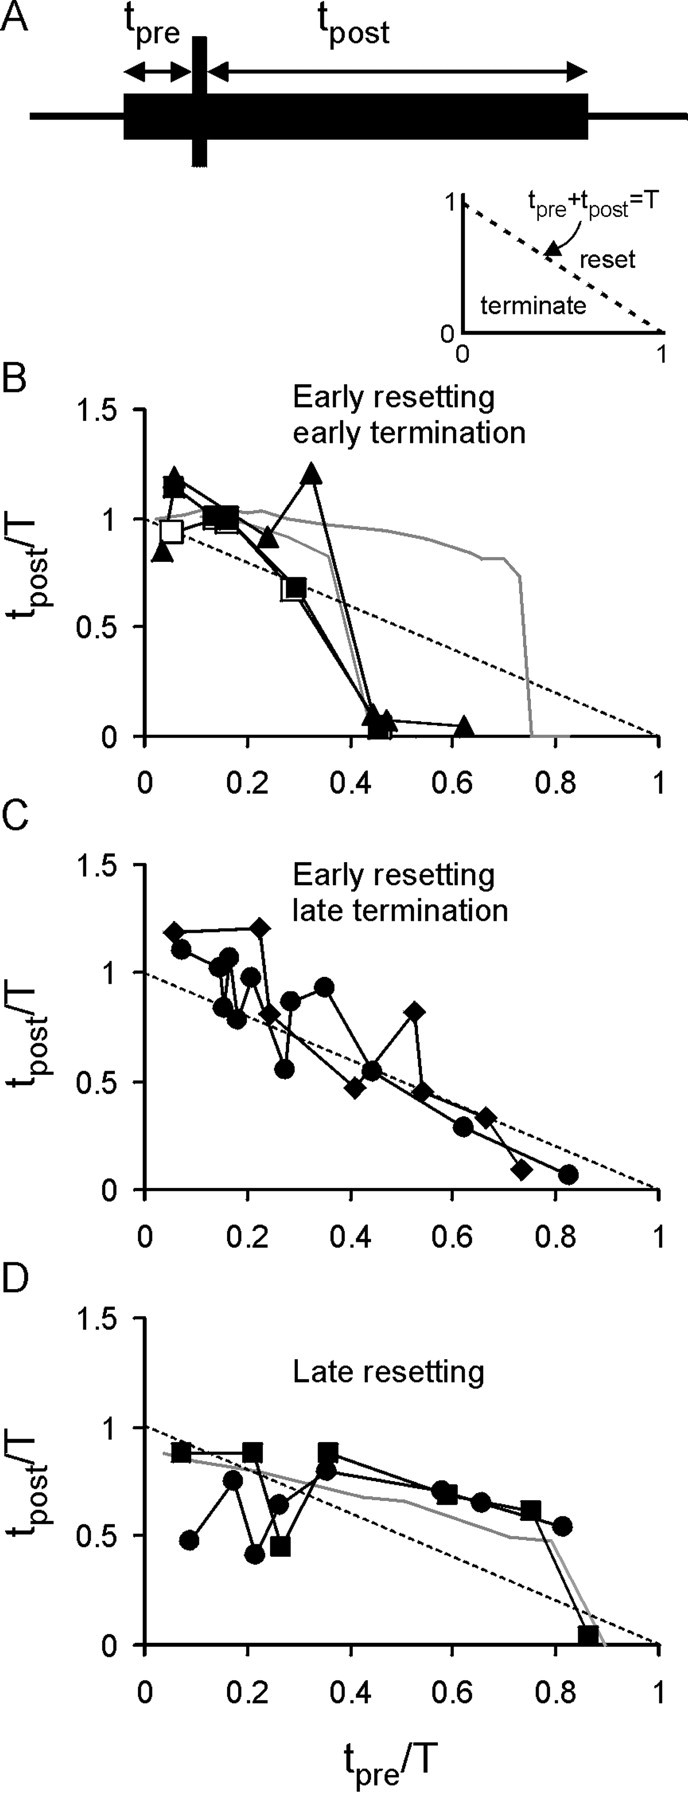
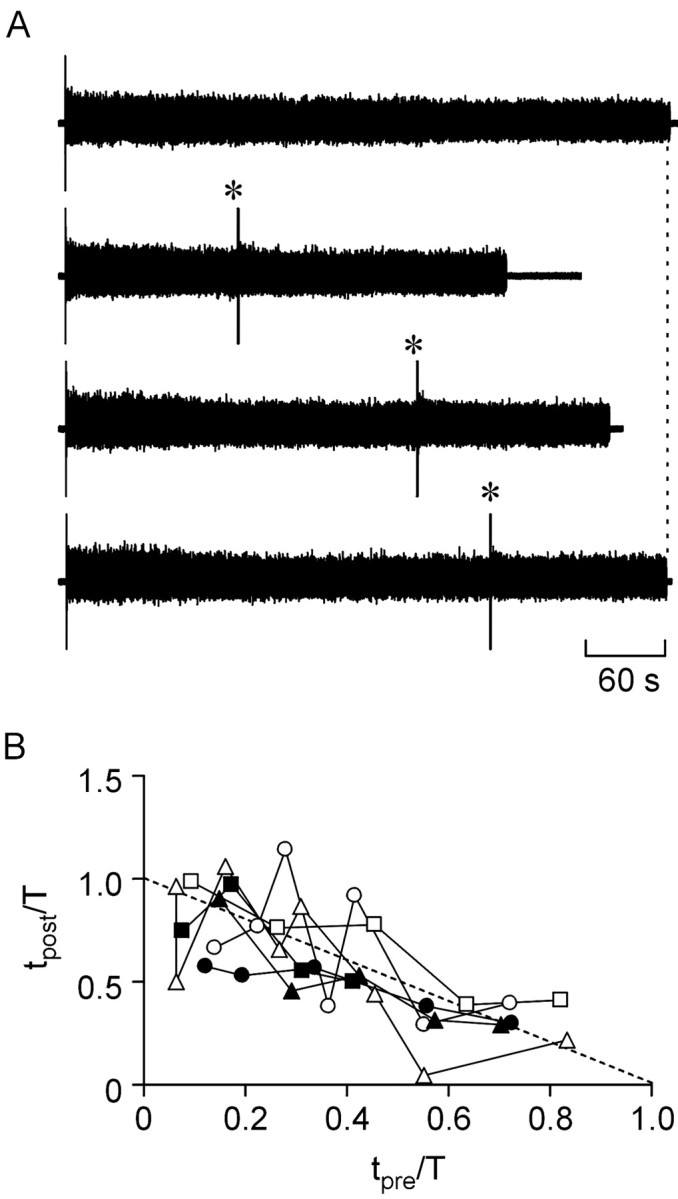
The purines, ATP and adenosine, control the rundown and termination of swimming in the Xenopus embryo. This intrinsic purinergic modulation, unavoidably present during every swimming episode, could lead to stereotyped inflexible behavior and consequently could jeopardize the survival of the embryo. To explore whether this control system can exhibit adaptability, I have used a minimal simulation in which a model neuron released ATP that (1) inhibited K+ currents and (2) was converted by ectonucleotidases to adenosine, which then inhibited Ca2+ currents. The model neuron exhibited an accommodating spike train controlled by the actions of ATP and adenosine. Feedforward inhibition by the upstream metabolite ADP of the ecto-5'-nucleotidase that converts AMP to adenosine introduced adaptability and allowed the resetting of spike accommodation. The strength of feedforward inhibition determined the extent to which resetting could occur. I have tested these predictions by examining swimming in the real embryo. The rundown of swimming was reset in a manner similar to that predicted by the single-neuron model. By blocking the purinoceptors, I have demonstrated that resetting in the embryo is attributable to the actions of the purines and results from feedforward inhibition of adenosine production. The resetting of rundown in the motor systems can be reformulated as an associative mechanism in which the temporal coincidence of two stimuli can prolong network activity if they fall within a particular time window. The length of the time window and the magnitude of the prolongation of neural activity both depend on the strength of the feedforward ADP-mediated inhibition of the ecto-5'-nucleotidase.


Figures

Fig. 1.
Fig. 1.
Analysis of enzyme kinetics shows that the resetting of adenosine (ADO) production is possible in principle. A, A simulation was run in which ATP was released at a constant rate of 100 μm/sec. After 2 sec, the rate of ATP release was elevated to 300 μm/sec.B, The same data as in A, but plotted on an expanded vertical axis to allow the changes in ATP and adenosine to be seen more clearly. The arrow highlights the fall in adenosine levels after the increase in ATP release. Note that the accumulation of adenosine over the first 2 sec is slowed by the presence of feedforward inhibition mediated by ADP.
Fig. 2.
Fig. 2.
The single-neuron model for purinergic modulation.A, A single neuron possessing Na+(data not shown) and K+ and Ca2+channels modulated by ATP and adenosine (ADO), respectively. ADP could inhibit the conversion of AMP to adenosine.B, The duration of the spike train depended on the strength of the feedforward inhibition. As feedforward inhibition by ADP increased (Ki gets smaller), the duration of the spike train increased. Example records of spiking activity in the model neuron are shown next to the appropriate points on the graph.
Fig. 3.
Fig. 3.
Resetting of the spike train in the model neuron. Each set of traces shows the membrane potential of the model neuron together with the concentrations of ATP, ADP, AMP, and adenosine (ADO). With Ki set to 2 μm, an accommodating train of spikes lasting ∼4 sec was evoked by current injection into the neuron (top trace). In the bottom sets oftraces, a second shorter current pulse was injected (*) during the first. Note that the total duration of spiking was prolonged compared with the control (middle two traces). If the second current pulse occurred past a certain time, the train was prematurely terminated (bottom trace).
Fig. 4.
Fig. 4.
With weaker feedforward inhibition (Ki = 3 μm), prolongation of the spike train and partial resetting of accommodation in response to a second stimulus (*) still occurred. However, the magnitude of the changes was less when compared with the stronger feedforward inhibition illustrated in Figure 3.
Fig. 5.
Fig. 5.
Summary graph demonstrating how the spike train can be reset by the second stimulus. Results for strong feedforward inhibition (Ki = 2 μm) are shown by circles (solid, 300 msec resetting pulse; open, 150 msec resetting pulse). Results for weaker feedforward inhibition (Ki = 3 μm) are shown bysquares (solid, 200 msec resetting pulse;open, 100 msec resetting pulse). Note how in both cases premature termination occurs earlier when the duration of the resetting pulse is shorter. The dashed line showstpre + tpost= T, and is the relationship expected when there is no resetting. Upward divergence from this line indicates resetting; downward divergence indicates premature termination.
Fig. 6.
Fig. 6.
Resetting of the spike train in the model neuron occurred because the elevated levels of ADP resulting from the second stimulus inhibit adenosine (ADO) production despite the greater levels of AMP present. A control trace(dashed lines) and reset trace(solid line) are shown superimposed. The vertical dotted lines show when the resetting stimulus was given.1 indicates the time taken for adenosine levels to recover to their pre-reset levels; 2 indicates the extra time taken for adenosine levels to rise high enough to terminate the spike train.
Fig. 7.
Fig. 7.
Increased inactivation ofINa causes premature termination of firing in the model neuron. Plots of membrane potential (Vmax), the Hodgkin–Huxley inactivation variable for INa(h), adenosine levels (Ado), percentage of block of the Ca2+ current (ICa) calculated from Equation 3, and injected current (I) versus time for a spike train that terminated normally (dashed lines) and one that terminated prematurely after a resetting pulse (solid line) are shown. The horizontal dotted linerepresents the maximal value of h achieved before the delivery of the resetting pulse. When premature termination after the resetting pulse did not occur (data not shown), hrecovered to the level of the dotted line.
Fig. 8.
Fig. 8.
Resetting of the rundown of swimming (as monitored by ventral-root activity) in the real embryo. 1, Ventral-root activity during a control episode. All other episodes illustrated have a resetting stimulus delivered where indicated by anasterisk. Note that the total duration of activity was extended when the resetting stimulus occurred early (2–4) but was shortened when the stimuli occurred later (5, 6). The vertical dashed line indicates end of control episode.
Fig. 9.
Fig. 9.
Analysis of resetting of swimming in embryos reveals that it is similar to that predicted by the model neuron.A, Schematic showing the measurement oftpre and tpostrelative to the resetting stimulus. The inset shows the normalized graph, with the dashed line indicating where no resetting takes place (tpre +tpost = T). Below this line, premature termination occurs; above the line, resetting occurs. B, Plots for three embryos, which showed a consistent pattern of early resetting followed by premature termination. This was very similar to the predictions from the model with strong feedforward inhibition (gray lines). C, Two additional embryos also exhibited early resetting but not premature termination.D, Two embryos in which late resetting took place. The resetting profile of these embryos was strikingly similar to that of the model with weaker feedforward inhibition (gray line).
Fig. 10.
Fig. 10.
Blockade of purine receptors prevented resetting of the rundown of swimming. Resetting was examined when the embryo was superfused with 10 μm PPADS and 2 μm 8PT to block the p2y and A1 receptors. A, Exampletraces showing a control episode (top trace) and three episodes in which a resetting stimulus was delivered (*). Note how resetting does not occur. Thevertical dashed line indicates end of control episode.B, Summary graphs analogous to those of Figure 9, showing the results for all six embryos. Note how the majority of points fall on or below the dashed line, which indicatestpre + tpost= T.

Similar articles

Cited by

References

    1. Braun N, Fengler S, Ebeling C, Servos J, Zimmermann H. Sequencing, functional expression and characterization of rat NTPDase6, a nucleoside diphosphatase and novel member of the ecto-nucleoside triphosphate diphosphohydrolase family. Biochem J. 2000;351:639–647. - PMC - PubMed
    1. Brown P, Dale N. Adenosine A1 receptors modulate high voltage-activated Ca2+ currents and motor pattern generation in the Xenopus embryo. J Physiol (Lond) 2000;525:655–667. - PMC - PubMed
    1. Brown P, Dale N. Modulation of K+ currents in Xenopus spinal neurons by p2y receptors: a role for ATP and ADP in motor pattern generation. J Physiol (Lond) 2002a;540:843–850. - PMC - PubMed
    1. Brown P, Dale N. Spike-independent release of ATP from Xenopus spinal neurons evoked by activation of glutamate receptors. J Physiol (Lond) 2002b;540:851–860. - PMC - PubMed
    1. Dale N. Kinetic characterization of the voltage-gated currents possessed by Xenopus embryo spinal neurons. J Physiol (Lond) 1995a;489:473–488. - PMC - PubMed

Publication types

MeSH terms