

Magnetic resonance microimaging of intraaxonal water diffusion in live excised lamprey spinal cord
- PMID: 12451179
- PMCID: PMC138587
- DOI: 10.1073/pnas.252249999
Magnetic resonance microimaging of intraaxonal water diffusion in live excised lamprey spinal cord
Abstract
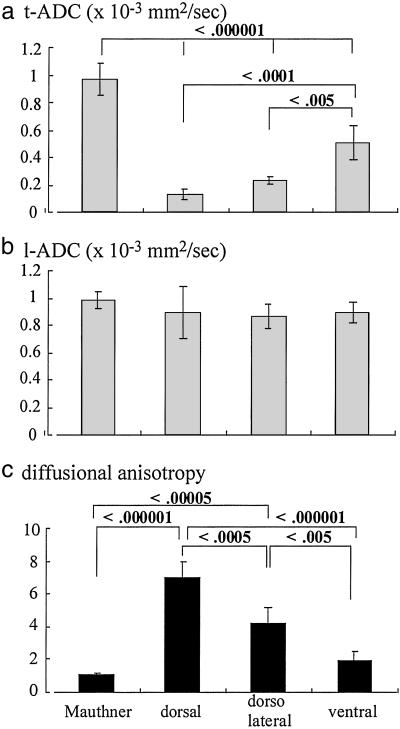
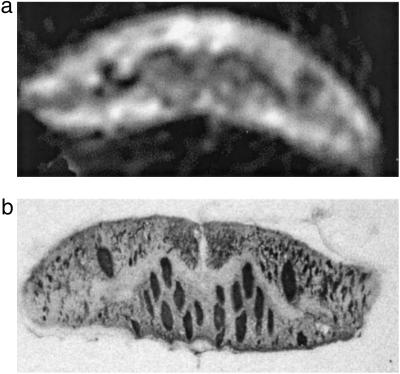
Anisotropy of water diffusion in axon tracts, as determined by diffusion-weighted MRI, has been assumed to reflect the restriction of water diffusion across axon membranes. Reduction in this anisotropy has been interpreted as degeneration of axons. These interpretations are based primarily on a priori reasoning that has had little empirical validation. We used the experimental advantages of the sea lamprey spinal cord, which contains several very large axons, to determine whether intraaxonal diffusion is isotropic and whether anisotropy is attributable to restriction of water mobility by axon surface membranes. Through the application of magnetic resonance microimaging, we were able to measure the purely intraaxonal diffusion characteristics of the giant reticulospinal axons (20-40 microm in diameter). The intraaxonal apparent diffusion coefficients of water parallel (longitudinal ADC, l-ADC) and perpendicular (transverse ADC, t-ADC) to the long axis were 0.98 +/- 0.06 (10(-3) mm2 sec) and 0.97 +/- 0.11 (10(-3) mm2 sec), respectively. In white matter regions that included multiple axons, l-ADCs were almost identical regardless of axon density in the sampled axon tract. By comparison, t-ADCs were reduced and varied inversely with the number of axons (and thus axolemmas) in a fixed cross-sectional area. Thus, diffusion was found to be isotropic when measured entirely within a single axon and anisotropic when measured in regions that included multiple axons. These findings support the hypothesis that the cell membrane is the primary source of diffusion anisotropy in fiber tracts of the central nervous system.
Figures
References
-
- Ono J., Harada, K., Takahashi, M., Maeda, M., Ikenaka, K., Sakurai, K., Sakai, N., Kagawa, T., Fritz-Zieroth, B. & Nagai, T. (1995) Brain Res. 671, 141-148. - PubMed
-
- Ono J., Harada, K., Mano, T., Sakurai, K. & Okada, S. (1997) Pediatr. Neurol. 16, 63-66. - PubMed
-
- Ford J. C., Hackney, D. B., Alsop, D. C., Jara, H., Joseph, P. M., Hand, C. M. & Black, P. (1994) Magn. Reson. Med. 31, 488-494. - PubMed
-
- Clark C. A., Werring, D. J. & Miller, D. H. (2000) Magn. Reson. Med. 43, 133-138. - PubMed
-
- Mori S., Crain, B. J., Chacko, V. P. & van Zijl, P. C. (1999) Ann. Neurol. 45, 265-269. - PubMed
Publication types
MeSH terms
Grants and funding
LinkOut - more resources
Full Text Sources
Medical
