

Vodka and violence: alcohol consumption and homicide rates in Russia
- PMID: 12453810
- PMCID: PMC1447353
- DOI: 10.2105/ajph.92.12.1921
Vodka and violence: alcohol consumption and homicide rates in Russia
Abstract
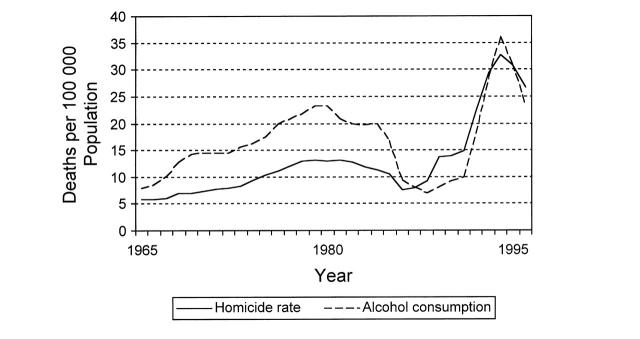
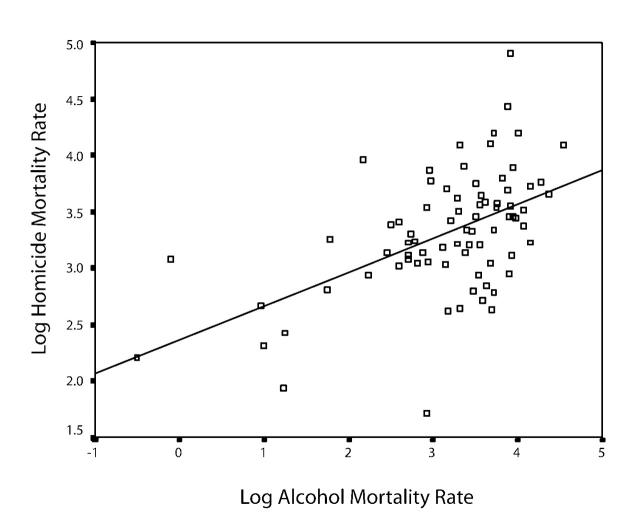
In Russia, rates of alcohol consumption and homicide are among the highest in the world, and already-high levels increased dramatically after the breakup of the Soviet Union. Rates of both, however, vary greatly among Russia's 89 regions. We took advantage of newly available vital statistics and socioeconomic data to examine the regional covariation of drinking and lethal violence. Log-log models were employed to estimate the impact of alcohol consumption on regional homicide rates, controlling for structural factors thought to influence the spatial distribution of homicide rates. Results revealed a positive and significant relationship between alcohol consumption and homicide, with a 1% increase in regional consumption of alcohol associated with an approximately 0.25% increase in homicide rates. In Russia, higher regional rates of alcohol consumption are associated with higher rates of homicide.
Figures
Similar articles
-
The effects of beverage type on homicide rates in Russia, 1970-2005.Drug Alcohol Rev. 2012 May;31(3):257-62. doi: 10.1111/j.1465-3362.2011.00310.x. Epub 2011 Mar 22. Drug Alcohol Rev. 2012. PMID: 21426423
-
Weekend effects on binge drinking and homicide: the social connection between alcohol and violence in Russia.Addiction. 2004 Aug;99(8):1034-41. doi: 10.1111/j.1360-0443.2004.00762.x. Addiction. 2004. PMID: 15265100 Free PMC article.
-
Alcohol consumption and rates of personal violence in Australia.Drug Alcohol Depend. 1992 Oct;31(1):15-7. doi: 10.1016/0376-8716(92)90003-u. Drug Alcohol Depend. 1992. PMID: 1425212
-
Predicting workplace aggression and violence.Annu Rev Psychol. 2009;60:671-92. doi: 10.1146/annurev.psych.60.110707.163629. Annu Rev Psychol. 2009. PMID: 18793089 Review.
-
[Murders and suicides as problem of public health].Probl Sotsialnoi Gig Zdravookhranenniiai Istor Med. 2006 Jan-Feb;(1):11-4. Probl Sotsialnoi Gig Zdravookhranenniiai Istor Med. 2006. PMID: 16680968 Review. Russian.
Cited by
-
The Huge Reduction in Adult Male Mortality in Belarus and Russia: Is It Attributable to Anti-Alcohol Measures?PLoS One. 2015 Sep 16;10(9):e0138021. doi: 10.1371/journal.pone.0138021. eCollection 2015. PLoS One. 2015. PMID: 26376439 Free PMC article.
-
Research Note: Patterns of Alcohol-Related Mortality in Russia.J Drug Issues. 2006;36(1):229-247. doi: 10.1177/002204260603600110. J Drug Issues. 2006. PMID: 16900263 Free PMC article.
-
Population-Level Alcohol Consumption and Homicide Rates in Latin America: A Fixed Effects Panel Analysis, 1961-2019.Br J Criminol. 2023 Oct 10;64(3):656-674. doi: 10.1093/bjc/azad056. eCollection 2024 May. Br J Criminol. 2023. PMID: 38638838 Free PMC article.
-
Prevalence and socio-economic distribution of hazardous patterns of alcohol drinking: study of alcohol consumption in men aged 25-54 years in Izhevsk, Russia.Addiction. 2007 Apr;102(4):544-53. doi: 10.1111/j.1360-0443.2006.01693.x. Addiction. 2007. PMID: 17362291 Free PMC article.
-
Poverty, Socioeconomic Change, Institutional Anomie, and Homicide.Soc Sci Q. 2005 Dec;86(S1):1377-1398. doi: 10.1111/j.0038-4941.2005.00351.x. Soc Sci Q. 2005. PMID: 16900262 Free PMC article.
References
-
- Pridemore WA. Demographic, temporal, and spatial patterns of homicide rates in Russia. Eur Soc Rev. In press.
-
- Reitan TC. Does alcohol matter? Public health in Russia and the Baltic countries before, during, and after the transition. Contemp Drug Probl. 2000;27:511–560.
-
- Leon DA, Chenet L, Shkolnikov VM, et al. Huge variation in Russian mortality rates, 1984–94: artefact, alcohol, or what? Lancet. 1997;350:383–388. - PubMed
-
- Leon DA, Shkolnikov VM. Social stress and the Russian mortality crisis. JAMA. 1998;279:790–791. - PubMed
-
- Simpura J, Levin BM, eds. Demystifying Russian Drinking. Helsinki, Finland: National Research and Development Centre for Welfare and Health; 1997. Research Report 85.
Publication types
MeSH terms
LinkOut - more resources
Full Text Sources
Medical
