

Power and design considerations for a general class of family-based association tests: quantitative traits
- PMID: 12454799
- PMCID: PMC378574
- DOI: 10.1086/344696
Power and design considerations for a general class of family-based association tests: quantitative traits
Abstract
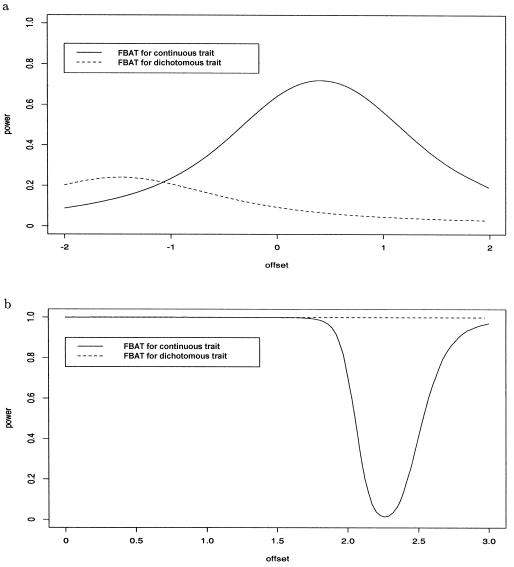
In the present article, we address family-based association tests (FBATs) for quantitative traits. We propose an approach to analytical power and sample-size calculations for general FBATs; this approach can be applied to virtually any scenario (missing parental information, multiple offspring per family, etc.). The power calculations are used to discuss optimal choices of the phenotypes for the FBAT statistic and its power's dependence on ascertainment conditions, on study design, and on the correct specification of the distributional assumptions for the phenotypes. We also compare the general FBAT approach with PDT and QTDT. The practical relevance of our theoretical considerations is illustrated by their application to an asthma study.
Figures
References
Electronic-Database Information
-
- FBAT Web Page, The, http://www.biostat.harvard.edu/~fbat/default.html (for the PBAT software package)
References
-
- Billingsley P (1995) Probability and measure. John Wiley, New York
Publication types
MeSH terms
Grants and funding
LinkOut - more resources
Full Text Sources
Medical
