. 2002 Dec;71(6):1369-85.
doi: 10.1086/344779. Epub 2002 Nov 21.

Multiplex relative risk and estimation of the number of loci underlying an inherited disease

Affiliations

Multiplex relative risk and estimation of the number of loci underlying an inherited disease

Paul Schliekelman et al. Am J Hum Genet. 2002 Dec.

Abstract

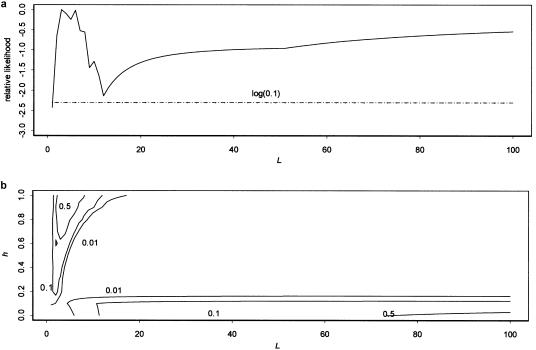
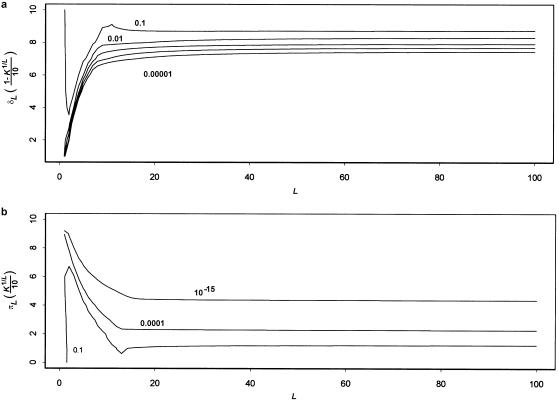
Knowledge of the number of causative loci is necessary to estimate the power of mapping studies of complex diseases. In the present article, we reexamine a theory developed by Risch and its implications for estimating the number L of causative loci affecting a complex inherited disease. We first show that methods based on Risch's analysis can produce estimates of L that are inconsistent with the observed population prevalence of the disease. We demonstrate this point by showing that the maximum-likelihood estimate for L produced by the method of Farrall and Holder for cleft lip/cleft palate data is not consistent with the prevalence under the multiplicative model. We show how to incorporate disease prevalence and develop a maximum-likelihood method for estimating L that uses the entire distribution of numbers of affected individuals in families containing an affected individual. This method avoids the potential inconsistencies of the Risch method and has greater precision. We apply our method to data on cleft lip/cleft palate and schizophrenia.


Figures

Figure  1
Figure 1
Allowed values of sib relative risk λS. The curves correspond to the overall disease prevalence K, as shown. Only combinations of λS and L under the curve are possible. The curve is given by equation (B7) and is valid only for the case of no dominance (h=1/2).
Figure  2
Figure 2
Effect of varying L. a, Effect of number of loci L on disease-allele frequency p. The curves correspond to values of the dominance coefficient h, as shown, and to K=0.01, δL=1, and πL=0.2. b, Effect of L on sib relative risk. The curves were generated with πL values of 0, 0.02, 0.05, 0.1, 0.15, and 0.2, ordered from top to bottom, as shown. For all plots, δL=1, and h=0.5.
Figure  3
Figure 3
Aunt-nephew relative risk as a function of L for a parent-offspring relative risk of 10. This curve was generated by equation (5) with λR=10 and CR/CS=1/2.
Figure  4
Figure 4
Effect of number of disease loci on multiplex-disease probabilities. a, Probability that two of three sibs of an affected individual are also affected. b, Probability that three of three sibs of an affected individual are also affected. Both curves were generated with K=0.01, h=0.5, δL=1, and πL=0.
Figure  5
Figure 5
Likelihood profiles for CLCP data. a, Likelihood profile for L. b, Contour plot of the likelihood versus L and h. The likelihood value shown is the maximum across the parameters not shown. The values shown on the contour lines are the likelihood of parameter combinations on that contour relative to the maximum-likelihood value. The likelihood for the multiplex-relative-risk method was generated using equation (9) and data from Carter et al. (1982) on offspring and sibs of probands. The log(0.1) curve shows the cutoff for the support interval (which includes all L values that are at least one-tenth as likely).
Figure  6
Figure 6
Likelihood contours for CLCP data. a, Likelihood of the CLCP data versus L and δL. b, Likelihood versus L and πL. For each L, δL ranged from slightly above K1/L (the lowest possible value) to 1, in increments of formula image. The Y-axis units gives these increments. Thus, the value of the Y-axis units in panel a changes with the X-axis variable L. The same holds for panel b: πL ranged from 0 to K1/L in increments of K1/L/10, and the Y-axis units have the same value.

Similar articles

Cited by

References

Electronic Database Information

    1. Paul Schliekelman's Web Site, http://www.stat.uga.edu/faculty/SCHLIEKELMAN/Paul.html

References

    1. Altmüller J, Palmer LJ, Fischer G, Scherb H, Wjst M (2001) Genomewide scans of complex human diseases: true linkage is hard to find. Am J Hum Genet 69:936–950 (erratum 69:1413) - PMC - PubMed
    1. Bear JC (1976) A genetic study of facial clefting in Northern England. Clin Genet 9:277–284 - PubMed
    1. Carter CO, Evans K, Coffey R, Roberts JA, Buck A, Roberts MF (1982) A three generation family study of cleft lip with or without cleft palate. J Med Genet 19:246–261 - PMC - PubMed
    1. Cordell HJ, Olson JM (2000) Correcting for ascertainment bias of relative-risk estimates obtained using affected-sib-pair linkage data. Genet Epidemiol 18:307–321 - PubMed
    1. Craddock N, Khodel V, Van Eerdewegh P, Reich T (1995) Mathematical limits of multilocus models: the genetic transmission of bipolar disorder. Am J Hum Genet 57:690–702 - PMC - PubMed

Publication types

MeSH terms