. 2003 Jan;18(1):1-12.
doi: 10.1002/hbm.10072.

Statistical flattening of MEG beamformer images

Affiliations

Statistical flattening of MEG beamformer images

Gareth R Barnes et al. Hum Brain Mapp. 2003 Jan.

Abstract

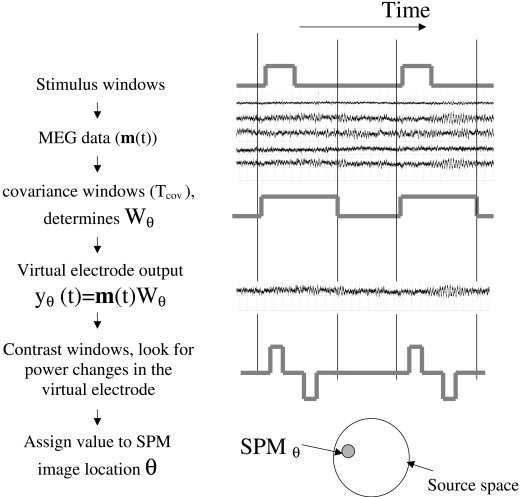
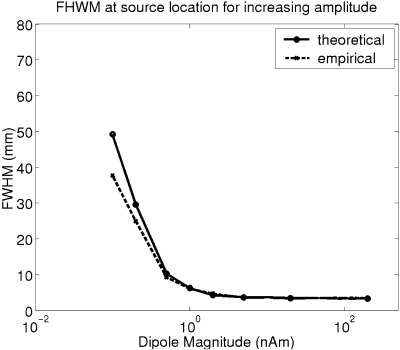
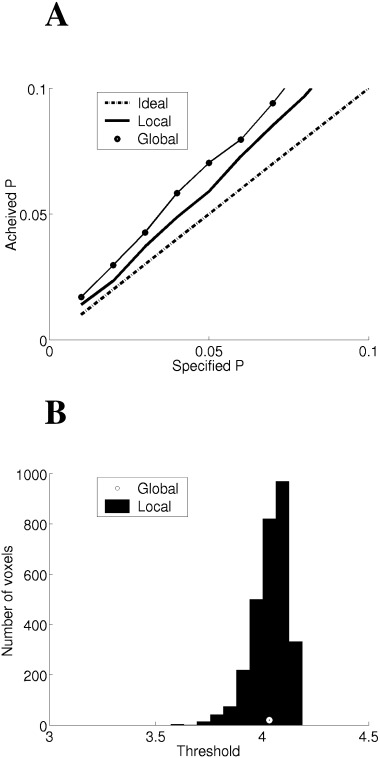
We propose a method of correction for multiple comparisons in MEG beamformer based Statistical Parametric Maps (SPMs). We introduce a modification to the minimum-variance beamformer, in which beamformer weights and SPMs of source-power change are computed in distinct steps. This approach allows the calculation of image smoothness based on the computed weights alone. In the first instance we estimate image smoothness by looking at local spatial correlations in residual images generated using random data; we then go on to show how the smoothness of the SPM can be obtained analytically by measuring the correlations between the adjacent weight vectors. In simulations we show that the smoothness of the SPM is highly inhomogeneous and depends on the source strength. We show that, for the minimum variance beamformer, knowledge of image smoothness is sufficient to allow for correction of the multiple comparison problem. Per-voxel threshold estimates, based on the voxels extent (or cluster size) in flattened space, provide accurate corrected false positive error rates for these highly inhomogeneously smooth images.


Figures

Figure 1
Figure 1
Schematic showing the partitioning of MEG data and the processing steps involved in making the SPM. The MEG data (m(t)) can be divided into epochs, each epoch containing a stimulus or task‐related time period defined by a stimulus window. A data segment of interest, or covariance window (Tcov), is used to calculate the MEG data covariance that in turn will determine the properties of the spatial filter (W θ). At each source location θ, the spatial filter gives rise to an estimate of the electrical activity (or virtual electrode output y θ(t)). A SPM value at θ is produced by statistical comparisons made on the virtual electrode output between the time‐frequency ranges specified by the contrast windows (in this case Tactive and Tpassive).
Figure 3
Figure 3
FWHM at the dipole location vs. source strength for a dipole simulated at approximately 3 cm depth for both analytical (solid) and empirical (dotted) smoothness estimates. As SNR increases the spatial filter becomes increasingly selective. The saturation (here at FWHM = 4 mm) is due to the spatial under‐sampling of the grid (2 mm spacing here). Note also that the analytical and empirical smoothness estimates are in good agreement.
Figure 2
Figure 2
Plots of spatial roughness (1/FWHM) of residual images (A,C) and subsequent SPM images (B,D) for source strengths 2 and 10 nAm respectively at a fixed dipole location (3 cm depth). The maps are in the coronal (x) plane with the z axis in the inferior‐superior direction passing through the dipole location and 1 cm anterior to the sphere centre. For (A,C), the maps are roughest, or least smooth, at the location of the simulated source. Note the change in smoothness across the images of approximately an order of magnitude. Also observable (A,C) are roughness peaks close to the sphere center, these peaks seem to arise due to numerical instability as the magnitudes of the lead field vectors approach 0. In this case, the minimum FWHMs are 8 mm and 5 mm for source of strengths of 2 and 10 nAm respectively. The SPMs were computed, based on a two‐sample t‐statistic, by using a contrast window in which Tpassive and Tactive contain data from 100 msec before and during the signal, respectively. The roughness maps depend solely on the choice of covariance window, whereas the t‐maps depend on the choice of contrast window as well.
Figure 4
Figure 4
(A) The false‐positive error rate per SPM volumetric image for the beamformer weights designed for the 0. 2 nAm source at 3 cm depth. Ideal false positive rates, where the achieved rate should match the required rate are shown as a dotted line. The use of a global thresholding strategy (circles), where uniform smoothness is assumed, tends to produce over inflated error rates. The use of local thresholding (solid), where the threshold for each voxel is determined from its extent in resel space, is very close to ideal. (B) The distribution of per voxel thresholds (histogram) as compared to the global threshold (point) for corrected significance level P < 0.05. It is clear that there is a wide spread of per voxel thresholds, being lowest around the simulated source, where the images are least smooth (Fig. 2).

Similar articles

Cited by

References

    1. Andrade A, Kherif F, Mangin JF, Worsley KJ, Paradis AL, Simon O, Dehaene S, Le Bihan D, Poline JB (2001): Detection of fMRI activation using cortical surface mapping. Hum Brain Mapp 12: 79–93. - PMC - PubMed
    1. Barnes GR, Francis S, Hillebrand A, He J, Furlong PL, Bowtell RW, Singh KD, Holliday IE, Morris PG (2001): The spatial relationship between event‐related changes in cortical synchrony and the haemodynamic response. Neuroimage 13: S71.
    1. Capon J (1969): High‐resolution frequency‐wavenumber spectrum analysis. Proc IEEE 57: 1408–1419.
    1. Cheyne D, Barnes GR, Holliday IE, Furlong PL (2000): Localization of brain activity associated with non‐time‐locked tactile stimulation using synthetic aperture magnetometry (SAM) In: Neonen J, Ilmoniemi T, Katila T, editors. 12th International Conference on Biomagnetism. Espoo, Finland: Helsinki Univ. of Technology; p 255–258.
    1. Friston KJ, Holmes A, Poline JB, Price CJ, Frith CD (1996a): Detecting activations in PET and fMRI: levels of inference and power. Neuroimage 4: 223–235. - PubMed

Publication types

LinkOut - more resources