

Investigating the generators of the scalp recorded visuo-verbal P300 using cortically constrained source localization
- PMID: 12454912
- PMCID: PMC6872109
- DOI: 10.1002/hbm.10073
Investigating the generators of the scalp recorded visuo-verbal P300 using cortically constrained source localization
Abstract
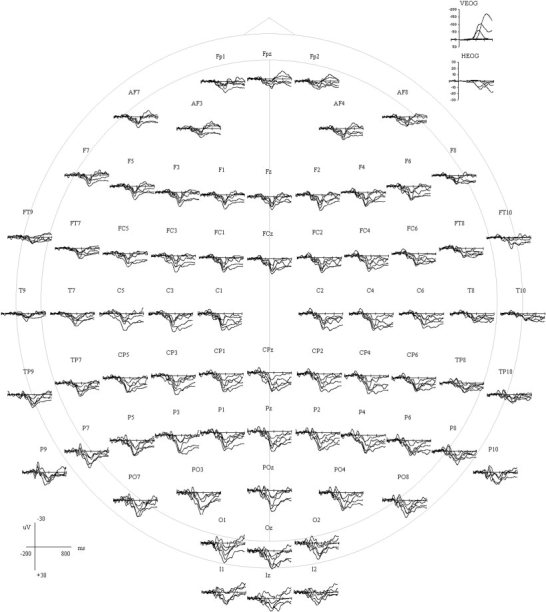
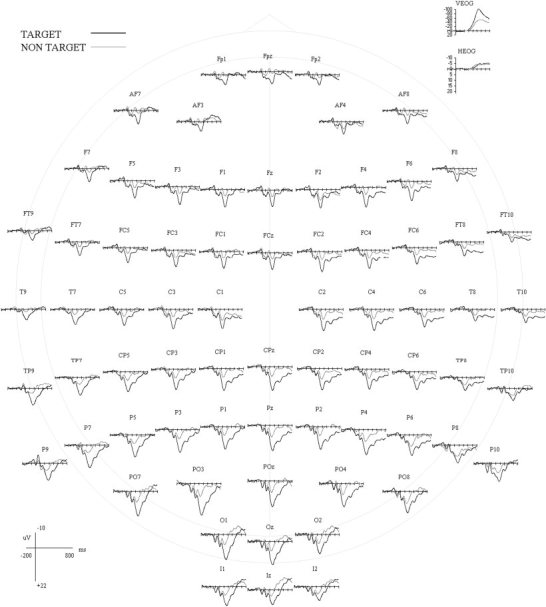
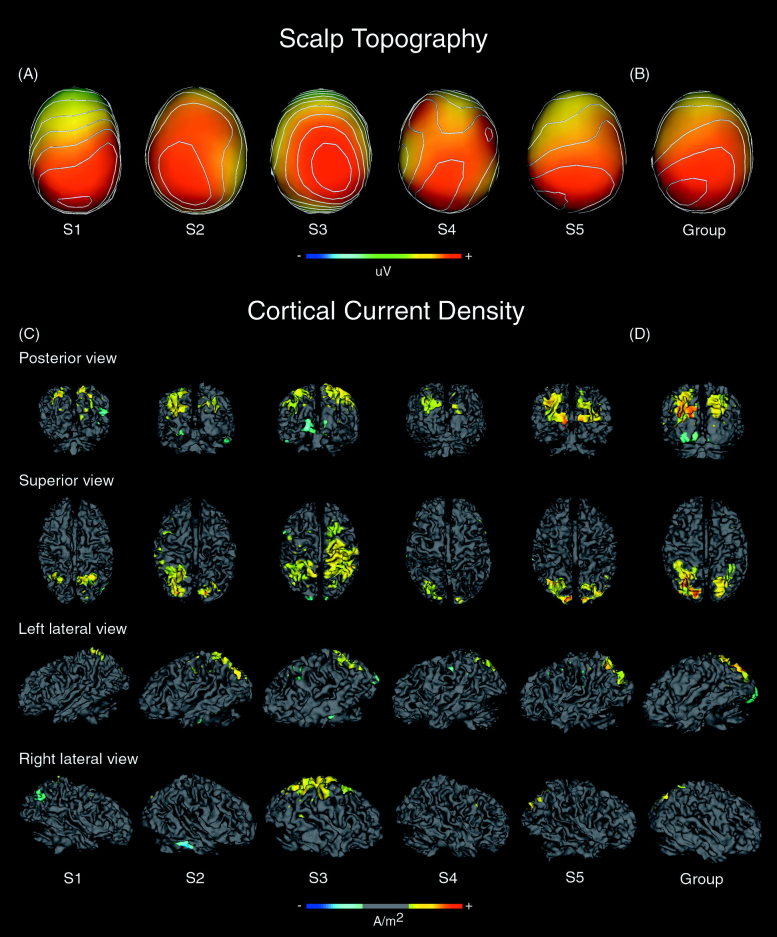
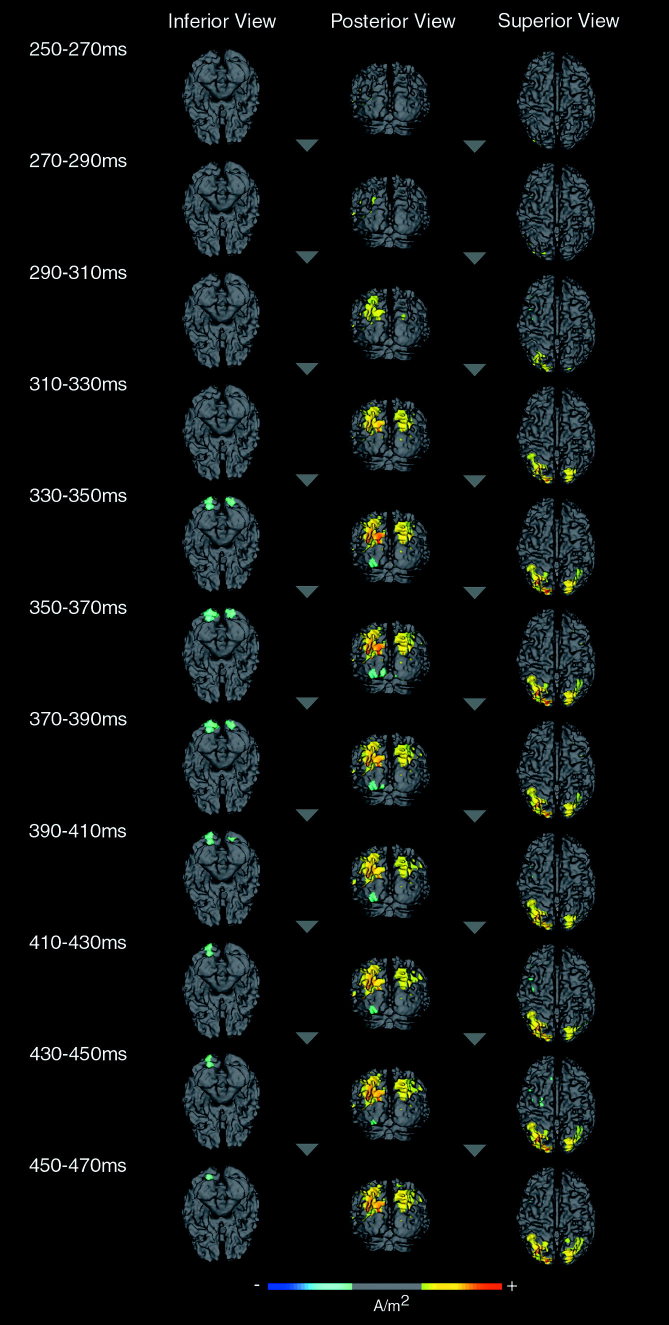
Considerable ambiguity exists about the generators of the scalp recorded P300, despite a vast body of research employing a diverse range of methodologies. Previous investigations employing source localization techniques have been limited largely to equivalent current dipole models, with most studies identifying medial temporal and/or hippocampal sources, but providing little information about the contribution of other cortical regions to the generation of the scalp recorded P3. Event-related potentials (ERPs) were recorded from 5 subjects using a 124-channel sensor array during the performance of a visuo-verbal Oddball task. Cortically constrained, MRI-guided boundary element modeling was used to identify the cortical generators of this target P3 in individual subjects. Cortical generators of the P3 were localized principally to the intraparietal sulcus (IPS) and surrounding superior parietal lobes (SPL) bilaterally in all subjects, though with some variability across subjects. Two subjects also showed activity in the lingual/inferior occipital gyrus and mid-fusiform gyrus. A group cortical surface was calculated by non-linear warping of each subject's segmented cortex followed by averaging and creation of a group mesh. Source activity identified across the group reflected the individual subject activations in the IPS and SPL bilaterally and in the lingual/inferior occipital gyrus primarily on the left. Activation of IPS and SPL is interpreted to reflect the role of this region in working memory and related attention processes and visuo-motor integration. The activity in left lingual/inferior occipital gyrus is taken to reflect activation of regions associated with modality-specific analysis of visual word forms.
Copyright 2002 Wiley-Liss, Inc.
Figures
Similar articles
-
Multiple dipole analysis of visual event-related potentials during oddball paradigm with silent counting.Brain Topogr. 2001 Spring;13(3):161-8. doi: 10.1023/a:1007851018184. Brain Topogr. 2001. PMID: 11302396 Clinical Trial.
-
Spatio-temporal stages in face and word processing. I. Depth-recorded potentials in the human occipital, temporal and parietal lobes [corrected].J Physiol Paris. 1994;88(1):1-50. doi: 10.1016/0928-4257(94)90092-2. J Physiol Paris. 1994. PMID: 8019524
-
Multiple equivalent current dipole source localization of visual event-related potentials during oddball paradigm with motor response.Brain Topogr. 2000 Spring;12(3):159-75. doi: 10.1023/a:1023467806268. Brain Topogr. 2000. PMID: 10791680
-
P300: the similarities and differences in the scalp distribution of visual and auditory modality.Brain Topogr. 1999 Summer;11(4):315-27. doi: 10.1023/a:1022262721343. Brain Topogr. 1999. PMID: 10449262
-
The neurophysiology of P 300--an integrated review.Eur Rev Med Pharmacol Sci. 2015 Apr;19(8):1480-8. Eur Rev Med Pharmacol Sci. 2015. PMID: 25967724 Review.
Cited by
-
Development of behavioral parameters and ERPs in a novel-target visual detection paradigm in children, adolescents and young adults.Behav Brain Funct. 2015 Jul 4;11:22. doi: 10.1186/s12993-015-0067-7. Behav Brain Funct. 2015. PMID: 26141640 Free PMC article.
-
Large-scale brain networks account for sustained and transient activity during target detection.Neuroimage. 2009 Jan 1;44(1):265-74. doi: 10.1016/j.neuroimage.2008.08.019. Epub 2008 Aug 28. Neuroimage. 2009. PMID: 18793734 Free PMC article.
-
Evoked Potentials Differentiate Developmental Coordination Disorder From Attention-Deficit/Hyperactivity Disorder in a Stop-Signal Task: A Pilot Study.Front Hum Neurosci. 2021 Mar 11;15:629479. doi: 10.3389/fnhum.2021.629479. eCollection 2021. Front Hum Neurosci. 2021. PMID: 33776670 Free PMC article.
-
Localizing P300 generators in visual target and distractor processing: a combined event-related potential and functional magnetic resonance imaging study.J Neurosci. 2004 Oct 20;24(42):9353-60. doi: 10.1523/JNEUROSCI.1897-04.2004. J Neurosci. 2004. PMID: 15496671 Free PMC article.
-
Electroencephalographic brain dynamics following manually responded visual targets.PLoS Biol. 2004 Jun;2(6):e176. doi: 10.1371/journal.pbio.0020176. Epub 2004 Jun 15. PLoS Biol. 2004. PMID: 15208723 Free PMC article.
References
-
- Alexander MP, Fischer RS, Friedman R. 1992. Lesion localization in apractic agraphia. Arch Neurol 49: 246–251. - PubMed
-
- Altafullah I, Halgren E, Stapleton JM, Crandall PH. 1986. Interictal spike wave complexes in the human medial temporal lobe: Typical topography and comparisons with cognitive potentials. Electroencephalogr Clin Neurophysiol 63: 503–506. - PubMed
-
- American Electroencephalographic Society . 1991. Guidelines for standard electrode position nomenclature. J Clin Neurophysiol 8: 200–202. - PubMed
-
- Anderer P, Pascual‐Marquird, Semlitsch MV, Saleto B. 1998. Differential effects of normal aging on sources of standard N1, target N1 and target P300 auditory event‐related brain potentials revealed by low resolution electromagnetic tomography (LORETA). Electroencephalogr Clin Neurophysiol 108: 160–174. - PubMed
-
- Andersen, RA . 1987. Inferior parietal lobule function in spatial perception and visuomotor integration In: Plum F, editor. Handbook of physiology, vol 5 Baltimore: American Physiological Society; p 483–518.
Publication types
MeSH terms
LinkOut - more resources
Full Text Sources
Miscellaneous
