. 2002 Oct;1(5):736-57.
doi: 10.1128/EC.1.5.736-757.2002.

Copper-dependent iron assimilation pathway in the model photosynthetic eukaryote Chlamydomonas reinhardtii

Affiliations

Copper-dependent iron assimilation pathway in the model photosynthetic eukaryote Chlamydomonas reinhardtii

Sharon La Fontaine et al. Eukaryot Cell. 2002 Oct.

Abstract

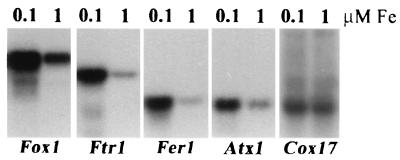
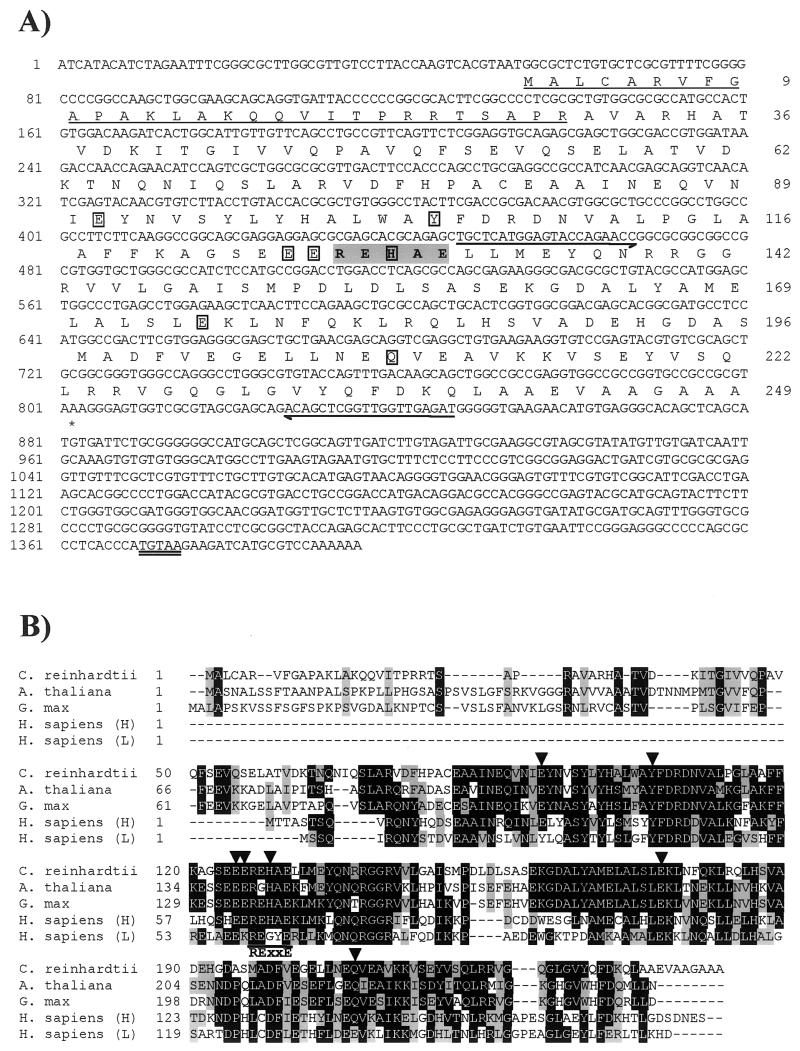
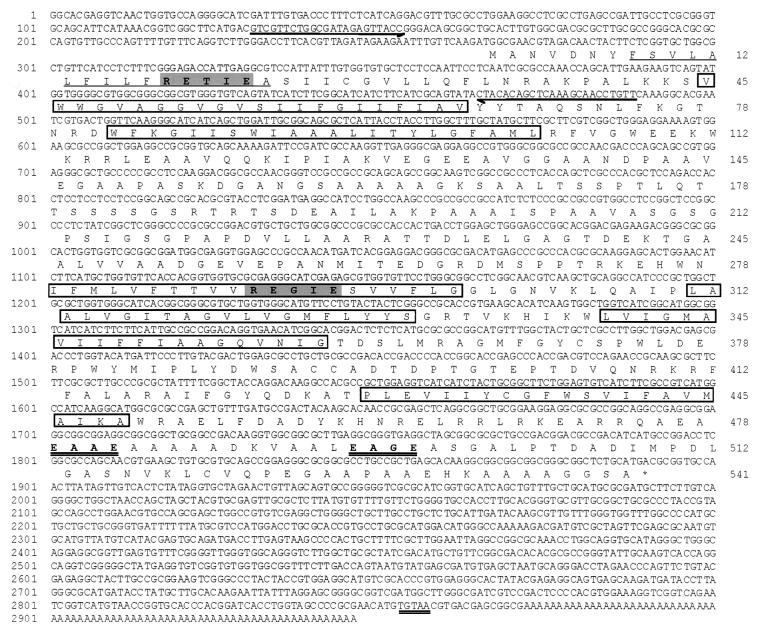
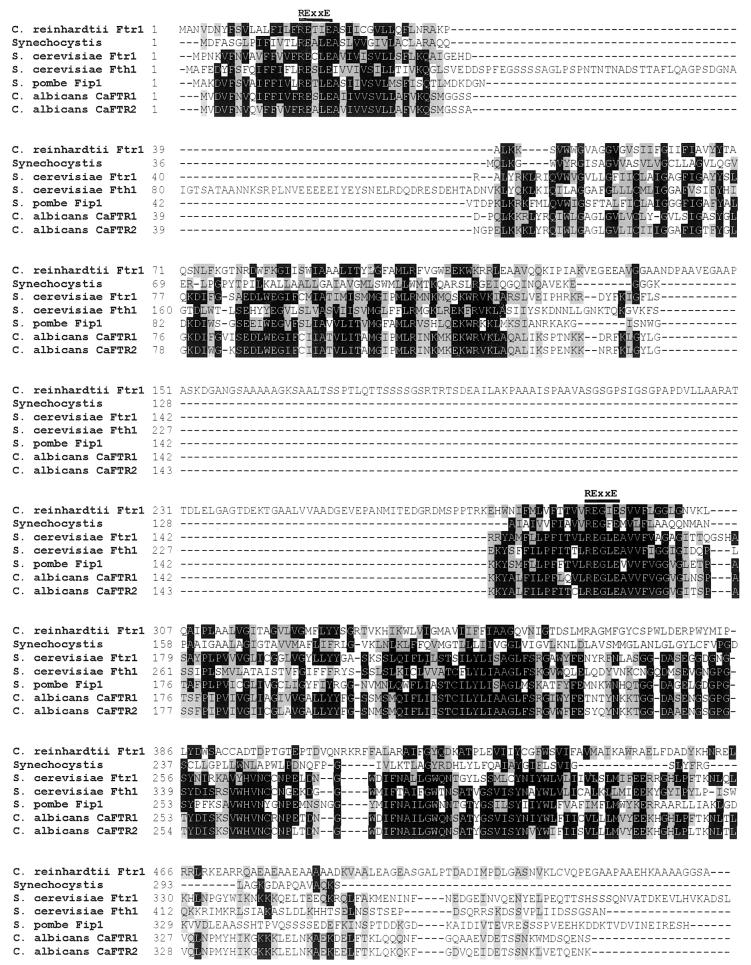
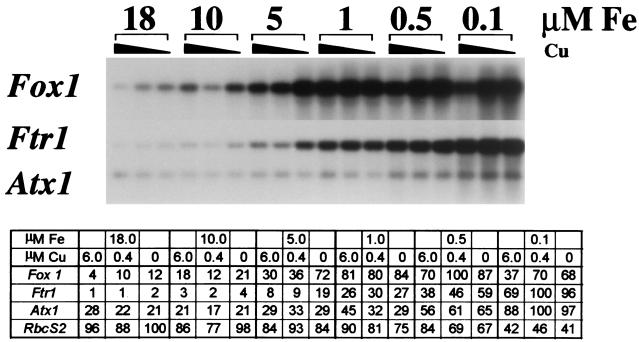
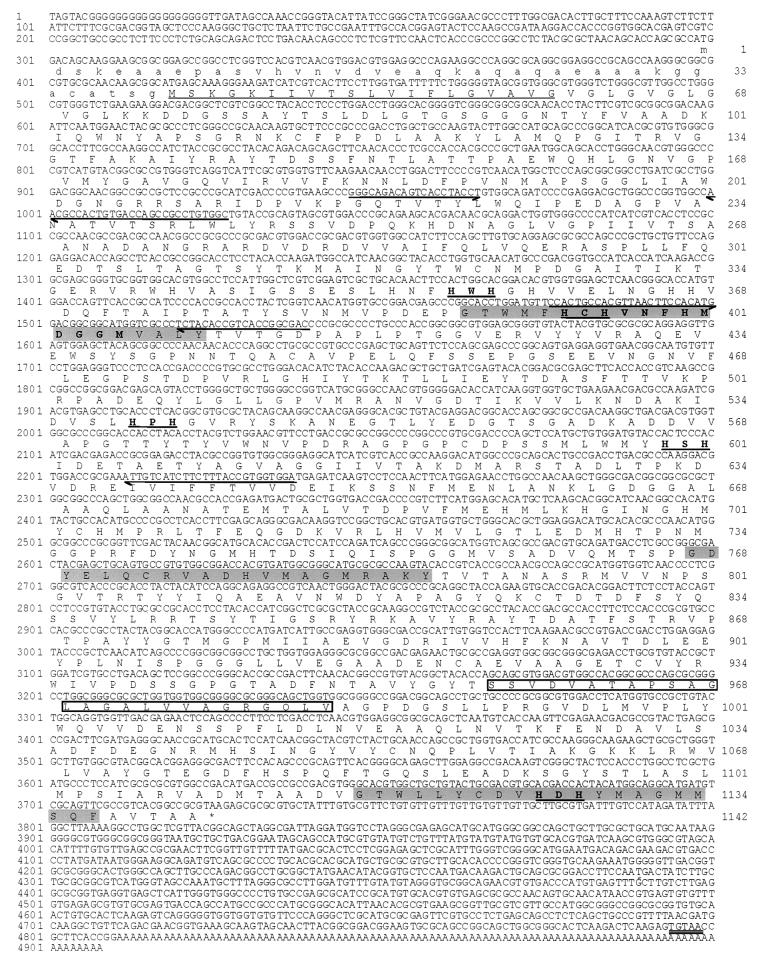
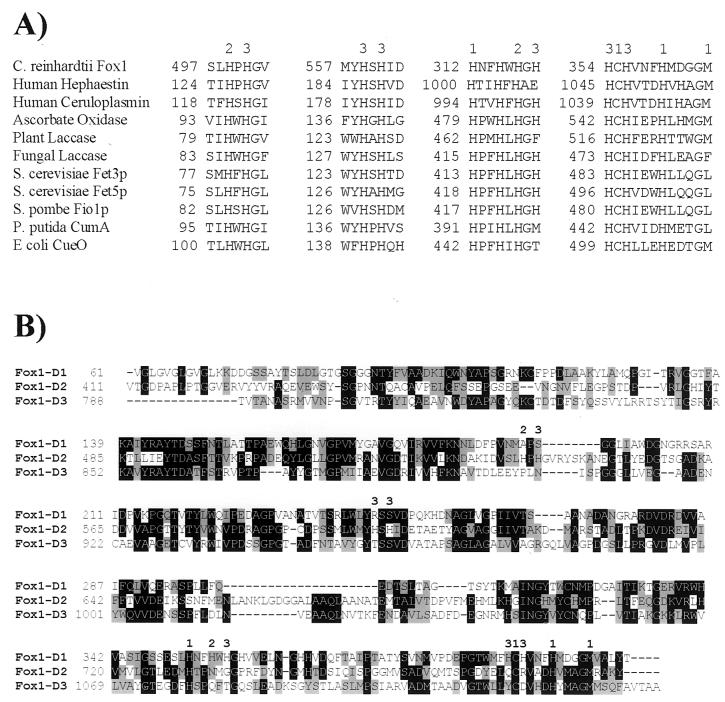
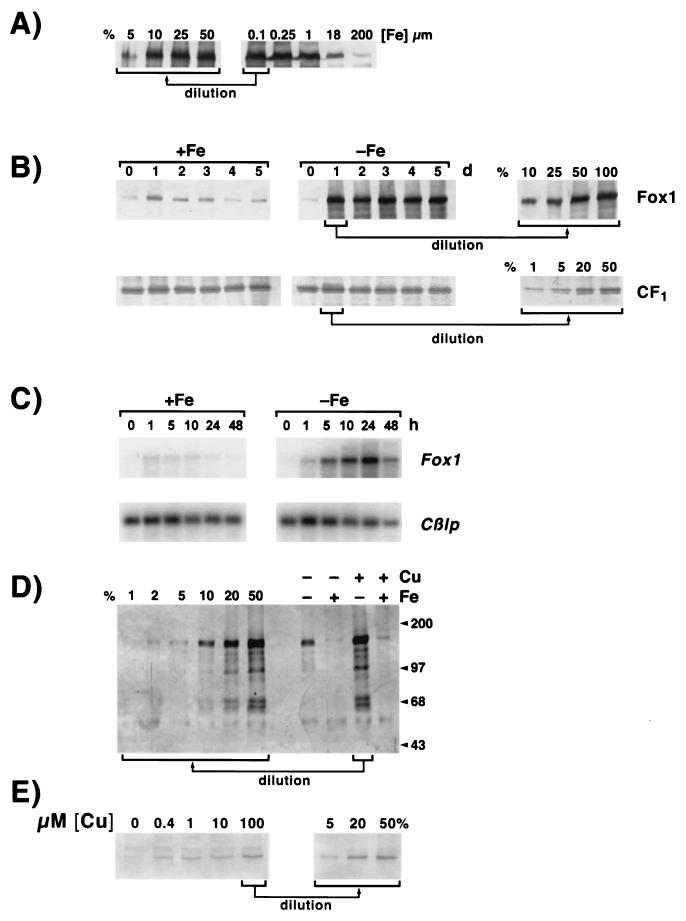
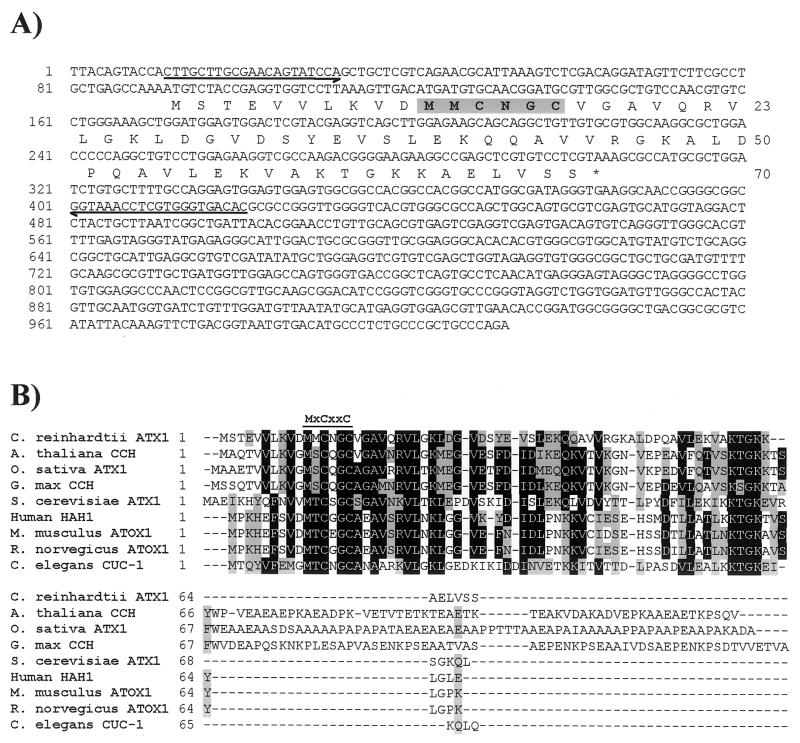
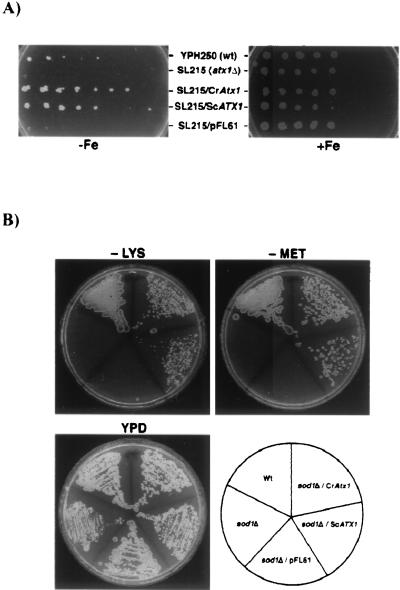
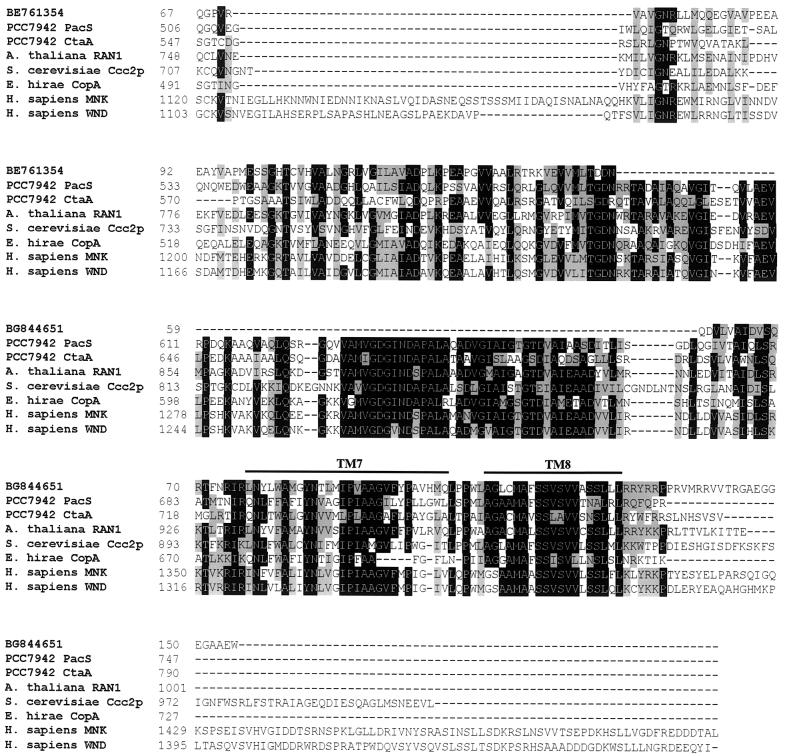
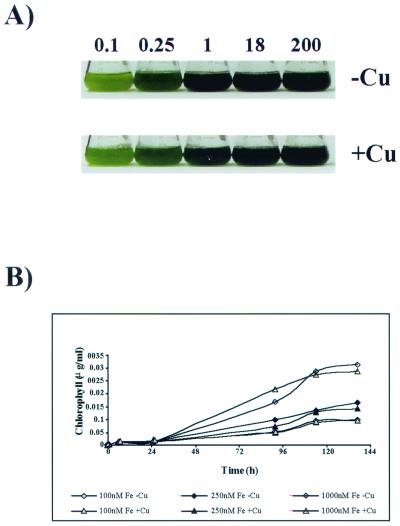
The unicellular green alga Chlamydomonas reinhardtii is a valuable model for studying metal metabolism in a photosynthetic background. A search of the Chlamydomonas expressed sequence tag database led to the identification of several components that form a copper-dependent iron assimilation pathway related to the high-affinity iron uptake pathway defined originally for Saccharomyces cerevisiae. They include a multicopper ferroxidase (encoded by Fox1), an iron permease (encoded by Ftr1), a copper chaperone (encoded byAtx1), and a copper-transporting ATPase. A cDNA, Fer1, encoding ferritin for iron storage also was identified. Expression analysis demonstrated that Fox1 and Ftrl were coordinately induced by iron deficiency, as were Atx1 and Fer1, although to lesser extents. In addition, Fox1 abundance was regulated at the posttranscriptional level by copper availability. Each component exhibited sequence relationship with its yeast, mammalian, or plant counterparts to various degrees; Atx1 of C. reinhardtii is also functionally related with respect to copper chaperone and antioxidant activities. Fox1 is most highly related to the mammalian homologues hephaestin and ceruloplasmin; its occurrence and pattern of expression in Chlamydomonas indicate, for the first time, a role for copper in iron assimilation in a photosynthetic species. Nevertheless, growth of C. reinhardtii under copper- and iron-limiting conditions showed that, unlike the situation in yeast and mammals, where copper deficiency results in a secondary iron deficiency, copper-deficient Chlamydomonas cells do not exhibit symptoms of iron deficiency. We propose the existence of a copper-independent iron assimilation pathway in this organism.


Figures

FIG. 1.
FIG. 1.
Increased accumulation of RNAs encoding iron metabolism components in iron-deficient Chlamydomonas cells. C. reinhardtii cells from a late-log culture in copper-free TAP medium were harvested and resuspended in 90 ml of −Cu TAP with 0.1 μM iron chelate. One milliliter was used to inoculate 100-ml cultures of +Cu TAP with either 0.1 μM iron chelate (cells severely chlorotic) or 1 μM iron chelate (chlorophyll content relatively unaffected compared to that of iron-replete cells). Cultures were grown to late log phase and transferred, and this process was repeated twice more to adapt cells to 1 or 0.1 μM iron chelate. Total RNA was prepared from late-log-phase cultures after three rounds and analyzed by hybridization with gene-specific probes as indicated. For quantitation, the signals were normalized to total RNA loaded. Specifically, the relative intensities (10−5) after object average background correction were as follows: Fox1, 25.2 and 8.7; Ftr1, 5.2 and 1.2; Fer1, 3.7 and 0.9; Atx1, 1.2 and 0.5; Cox17, 0.05 and 0.05. For RbcS2, the signal was actually decreased in 0.1 μM iron samples. The relative intensities (10−5) were 20.6 and 44.8. Transcript sizes were as follows: Fox1, 5.2 kb; Ftr1, 2.8 kb; Fer1, 1.3 kb; and Atx1, 1.0 kb. They were estimated from a standard curve of the relative mobility of each marker (Gibco BRL; 0.24- to 9.5-kb RNA marker) versus log10 of its size in bases.
FIG.2.
FIG.2.
Sequence analysis of Fer1. (A) Nucleotide and amino acid sequences of Fer1. The nucleotide sequence of 1.4 kb of the Fer1 cDNA is shown. The sequence was determined for clone LC007f05 (Kazusa DNA Research Institute) by Qiagen Genomics. The numbers on the left refer to the nucleotide sequence, which is numbered +1 from the first nucleotide of the assembled sequence. The deduced amino acid sequence of the longest ORF is given below the nucleotide sequence. The numbers on the right indicate the positions of the amino acids in the reading frame. The putative transit peptide is underlined. Boxes denote conserved amino acids required for ferroxidase activity. The iron-binding RExxE motif is given in boldface and shaded gray. Half-arrows denote the sequences of primers used for PCR. The putative polyadenylation signal is double underlined. (B) Amino acid sequence alignment of C. reinhardtii Fer1 with ferritins from other organisms. The alignment was generated by using the ClustalW algorithm and BioEdit software (34). Residues that are similar or identical in a majority of sequences are shaded gray and black, respectively. The conserved amino acids required for ferroxidase activity are indicated by arrowheads above the alignment. The conserved RExxE motif is indicated by a line below the alignment. GenBank accession numbers: A. thaliana, AF229850; G. max, U31648; H. sapiens ferritin light chain, P02792; H. sapiens ferritin heavy chain, XP_043419.
FIG. 3.
FIG. 3.
Analsyis of the Ftr1 cDNA. The nucleotide sequence of the 2.9-kb cDNA from clone CL42d10 corresponding to EST AV395492 (Kazusa DNA Research Institute) is shown with the deduced amino acid sequence of the longest ORF given below the nucleotide sequence. The numbers on the left refer to the nucleotide sequence, which is numbered +1 from the first nucleotide of the GenBank entry. The numbers on the right indicate the positions of the amino acids in the reading frame. The polyadenylation signal is double underlined. The putative N-terminal signal peptide is underlined. Boxes denote sequences corresponding to putative transmembrane regions. The iron-binding RExxE motifs are given in boldface and shaded gray. The ExxE motifs are double underlined. Half-arrows denote the sequences of primers used for PCR.
FIG. 4.
FIG. 4.
Alignment of C. reinhardtii Ftr1 with Ftr1 homologues from other organisms. The alignment was generated by using the ClustalW algorithm and BioEdit software (34). Residues that are similar or identical in a majority (four) of sequences are shaded gray and black, respectively. A line above the alignment indicates the conserved RExxE motifs. GenBank accession numbers: C. reinhardtii Ftr1, AF478411; Synechocystis, BAA16870, S. cerevisiae Ftr1p, NP_011072; S. cerevisiae Fth1p, AF177330; S. pombe Fip1, AF177330; C. albicans CaFTR1, AF195775; and C. albicans CaFTR2, AF195776.
FIG. 5.
FIG. 5.
Increased abundance of Fox1, Ftr1, and Atx1 transcipts as medium iron is reduced. A 100-ml culture of C. reinhardtii was adapted to low iron (0.1 μM in copper-free TAP medium) at late log phase and was used to inoculate cultures with the indicated iron concentrations and copper to either 6 μM (normal copper-supplemented TAP medium), 0.4 μM (saturating for Cyc6 repression and plastocyanin biosynthesis [76]), or 0 μM. RNA was harvested the following day when the cultures were at mid-log phase (2 × 10⁶ to 3 × 10⁶ cells ml−1) and analyzed by RNA hybridization. Parallel samples were probed for RbcS2 expression for quantitation of the data (tabulated). The relative intensities were obtained after object average background correction. The values in the table represent the signal for each sample relative to the maximum intensity for each probe, which was arbitrarily set at 100.
FIG. 6.
FIG. 6.
Sequence analysis of Fox1. The nucleotide sequence shown is derived from the 5′-RACE product (positions 1 to 852) and the insert in clone CL48f10 corresponding to EST AV395796 (Kazusa DNA Research Institute) (positions 787 to 4908). The numbers on the left refer to the nucleotide sequence, which is numbered +1 from the first nucleotide of the GenBank entry. The deduced amino acid sequence of the longest ORF is given below the nucleotide sequence. The numbers on the right indicate the positions of the amino acids in the reading frame. The first methionine is numbered +1. The first 40 amino acids are shown in lowercase since the relationship of Fox1 with other MCOs suggests that the second methionine residue is likely to represent the initiator methionine. The putative N-terminal signal peptide is underlined, and the C-terminal transmembrane region is boxed. The polyadenylation signal is double underlined. Gray shading denotes sequences corresponding to MCO signature 1, while MCO signature 2 is given in boldface. The His-Xaa-His motifs are given in boldface and underlined. Half-arrows denote the sequences of primers used for 5′-RACE and PCR.
FIG. 7.
FIG. 7.
Domain-like structure of the Fox1 product with candidate copper binding ligands. The potential ligands for type I, type II, and type III copper binding sites are designated 1, 2, and 3, respectively. (A) Alignment of amino acid sequences of the putative copper binding sites in Fox1 with those of other MCOs. GenBank accession numbers: C. reinhardtii Fox1, AF450137; human hephaestin, AF148860; human ceruloplasmin, XM011006; ascorbate oxidase, A51027; plant laccase, U12757; fungal laccase, 17943174; S. cerevisiae Fet3p, P38993; S. cerevisiae Fet5p, P38993; S. pombe Fio1p, CAA91955; P. putida CumA, CAA91955; and E. coli CueO (yacK), P36649. (B) Alignment of Fox1 domains. The putative ligands for type I, II, and III copper binding sites within each domain are shown above the alignment. Each domain contained the four ligands (His, Cys, His, and Met) that characterize a type I Cu binding site. The numbers on the left indicate the amino acid position within the sequence.
FIG. 8.
FIG. 8.
Fox1 abundance in iron-deficient Chlamydomonas. Protein extracts from C. reinhardtii cells grown in TAP medium containing various concentrations of copper and iron, and collected at a density of 107 cells ml−1, were prepared as described in Materials and Methods. Extracts were analyzed after separation by denaturing gel electrophoresis (7.5% acrylamide), transfer to nitrocellulose (1 h, 100 V, in 25 mM Tris-192 mM glycine-0.04% [wt/vol] SDS-20% [vol/vol] methanol), and incubation with anti-Fox1 antiserum (1:300 dilution). Bound antibody was visualized colorimetrically after incubation with alkaline phosphatase-conjugated secondary antibody. (A) The Fox1 gene product accumulates in −Fe cells. Cells grown in medium containing 200 μM added Fe-EDTA were transferred to fresh medium supplemented with 0.1, 0.25, 1, 18, or 200 μM Fe-EDTA and sampled after 5 days of growth. Protein extracts from 2.5 × 10⁶ cells were analyzed as described above. Samples were normalized for loading on the basis of equal cell numbers and verified for accumulation of CF1, which is iron independent (see Materials and Methods). Percentages on the left are the fractional amounts of the “0.1 μM Fe” sample that were loaded. (B) Time course of Fox1 induction in −Fe cells. Cells grown with 200 μM added Fe-EDTA were transferred to fresh medium lacking iron (−Fe) or containing 200 μM added Fe-EDTA (+Fe). Cultures were sampled each day for 5 days (d), and ferroxidase abundance was analyzed as described above. Percentages shown on the right arethe amounts of the day 1 sample that were loaded. The accumulation of the α and β subunits of CF1 is shown as a loading control. (C) Time course of Fox1 mRNA accumulation upon transfer from Fe-replete (200 μM) to Fe-deficent (0 μM) medium. Cultures were sampled at the indicated time after transfer for RNA isolations. The RNAs were analyzed by blot hybridization. The Cβlp mRNA was used as an internal control. Its behavior as a function of cell growth and iron nutrition is typical of many other RNAs. (D) Cu is required for accumulation of Fox1. C. reinhardtii was cultured in copper-supplemented (6 μM, +Cu) or copper-deficient (no added copper, −Cu), iron-supplemented (18 μM, +Fe) or iron-deficient (no added iron, −Fe) TAP medium. One microliter of protein extract from 4 × 10⁸ cells was analyzed as described above. Percentages on the left are the fraction of the −Fe-+Cu sample that was applied for quantitation. Molecular masses of markers (Gibco BRL) are indicated in kilodaltons. (E) Cu-dependent accumulation of Fox1 in iron-replete cells. Copper-deficient, iron-replete (18 μM) CC125 cells were transferred to fresh (0 μM supplemental iron) medium containing the indicated amounts of copper and sampled for immunoblot analysis of Fox1 accumulation after 3 days. Each lane was loaded with material from 2 × 10⁷ cells (equivalent to approximately 5 μg of chlorophyll). Percentages on the right are the fraction of the sample from medium containing 100 μM supplemental copper.
FIG. 9.
FIG. 9.
Analysis of the Atx1 cDNA. (A) The nucleotide sequence of the 1.0-kb Atx1 cDNA is shown. The sequence was determined for clone CM017g07 (Kazusa DNA Research Institute) by Qiagen Genomics (this study; GenBank accession no. AY120936). A poly(A) tail was not present within the sequenced insert from clone CM017g07 but was identified within EST BE441651 at a position corresponding to 1007 of the sequence shown. The numbers on the left refer to the nucleotide sequence, which is numbered +1 from the first nucleotide of ESTs AV631680, AV638507, and BE441652. The deduced amino acid sequence of the longest ORF is given below the nucleotide sequence. The numbers on the right indicate the positions of the amino acids in the reading frame. The putative copper binding motif is shown in boldface and gray shading. Half-arrows denote the sequences of primers used for PCR. (B) Amino acid sequence alignment of C. reinhardtii Atx1 with homologues from other organisms. The alignment was generated by using the ClustalW algorithm and BioEdit software (34). Residues that are similar or identical in a majority (five) of sequences are shaded gray and black, respectively. The conserved MxCxxC motif is indicated by a line above the alignment. GenBank accession numbers: C. reinhardtii Atx1, AF280056; A. thaliana CCH, U88711; O. sativa ATX1, AF198626; G. max CCH, T50778; S. cerevisiae ATX1, T50778; H. sapiens HAH1, U70660; M. musculus ATOX1, AF004591; R. norvegicus ATOX1, NM_053359; C. elegans CUC-1, AB017201.
FIG. 10.
FIG. 10.
Chlamydomonas Atx1 rescued S. cerevisiae atx1 and sod1 mutants. (A) Complementation of iron-deficient growth in S. cerevisiae atx1Δ mutant strain SL215. S. cerevisiae strains YPH250 (wt), SL215 (atxΔ), and SL215 transformed with CrAtx1, ScATX1, or control vector pFL61 were serially diluted and grown on SD complete medium containing the iron chelator ferrozine (1.5 mM) in the absence (−Fe) or presence (+Fe) of 350 μM ferrous ammonium sulfate. (B) Complementation of aerobic lysine and methionine auxotrophy of S. cerevisiae sod1Δ mutant. wt, sod1Δ mutant, and sod1Δ strains transformed with CrAtx1, ScATX1, or control vector pFL61 were grown on YPD or SD complete medium lacking lysine or methionine.
FIG. 11.
FIG. 11.
Sequence comparison between C. reinhardtii ESTs and copper ATPases. The predicted amino acid sequences encoded by C. reinhardtii ESTs (GenBank accession no. BE761354 and BG844651) were aligned with the relevant regions of copper-transporting ATPases from other organisms. The alignment was generated by using the ClustalW algorithm and BioEdit software (34). The numbers indicate the positions of the amino acids in each sequence. The first sequence in the alignment represents the amino acids encoded by the two C. reinhardtii ESTs, which align with different regions of the copper ATPases but are derived from a single gene. The alignment of the ESTs was based on BLAST output. Residues that are similar or identical in a majority (five) of sequences are shaded gray and black, respectively. A line above the alignment indicates the transmembrane regions. GenBank accession numbers: Synechococcus PacS, P37279; Synechococcus CtaA, AAB82020; A. thaliana RAN1, AF082565; S. cerevisiae Ccc2p, L36317; E. hirae CopA, L13292; H. sapiens MNK, NM_000052; H. sapiens WND, NM_000053.
FIG. 12.
FIG. 12.
Effect of iron concentration on growth of C. reinhardtii. (A) C. reinhardtii was grown to exponential phase in TAP medium and then subcultured into TAP medium containing the indicated iron supplement and either 6 μM copper (+Cu) or no copper (−Cu), and growth was monitored over a period of 6 days. (B) C. reinhardtii was cultured in TAP medium containing iron concentrations that ranged from 100 nM (−Fe) to 1 μM (+Fe) and either 0 μM (−Cu) or 6 μM copper (+Cu). The cell number of each culture was monitored over a period of 6 days, and chlorophyll content as a measure of iron sufficiency was monitored over the same time period by removing 10 μl of the culture into 1.0 ml of 80% acetone-20% methanol. All measurements were carried out in duplicate.

References

    1. Abboud, S., and D. J. Haile. 2000. A novel mammalian iron-regulated protein involved in intracellular iron metabolism. J. Biol. Chem. 275:19906-19912. - PubMed
    1. Aisen, P., M. Wessling-Resnick, and E. A. Leibold. 1999. Iron metabolism. Curr. Opin. Chem. Biol. 3:200-206. - PubMed
    1. Andrews, N. C. 1999. The iron transporter DMT1. Int. J. Biochem. Cell Biol. 31:991-994. - PubMed
    1. Asamizu, E., Y. Nakamura, S. Sato, H. Fukuzawa, and S. Tabata. 1999. A large scale structural analysis of cDNAs in a unicellular green alga, Chlamydomonas reinhardtii. I. Generation of 3433 non-redundant expressed sequence tags. DNA Res. 6:369-373. - PubMed
    1. Askwith, C., D. Eide, A. Van Ho, P. S. Bernard, L. Li, S. Davis-Kaplan, D. M. Sipe, and J. Kaplan. 1994. The FET3 gene of S. cerevisiae encodes a multicopper oxidase required for ferrous iron uptake. Cell 76:403-410. - PubMed

Publication types

MeSH terms

LinkOut - more resources