. 2002 Apr;1(2):293-303.
doi: 10.1128/EC.1.2.293-303.2002.

Role of histone deacetylation in developmentally programmed DNA rearrangements in Tetrahymena thermophila

Affiliations

Role of histone deacetylation in developmentally programmed DNA rearrangements in Tetrahymena thermophila

Sandra Duharcourt et al. Eukaryot Cell. 2002 Apr.

Abstract

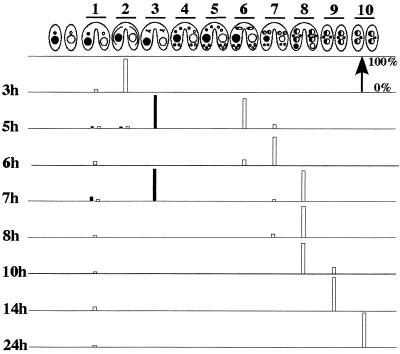
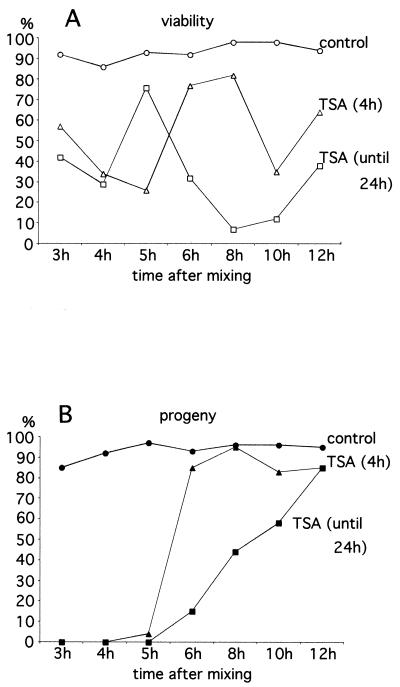
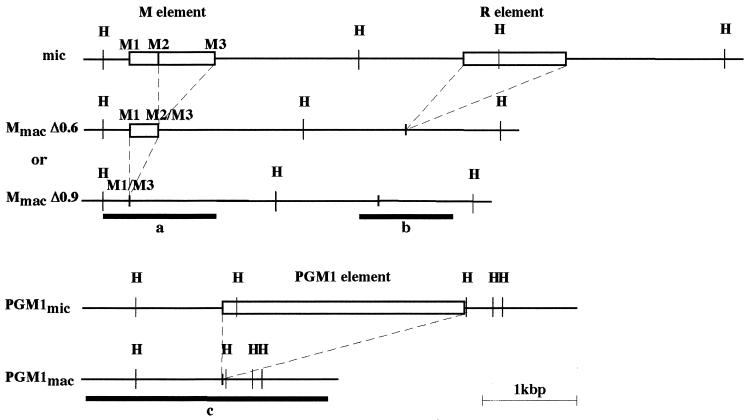
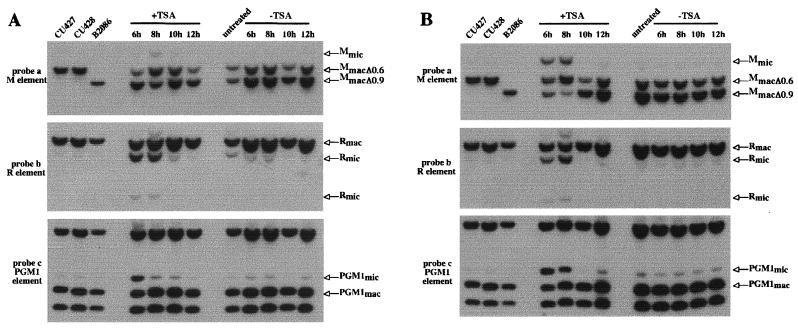
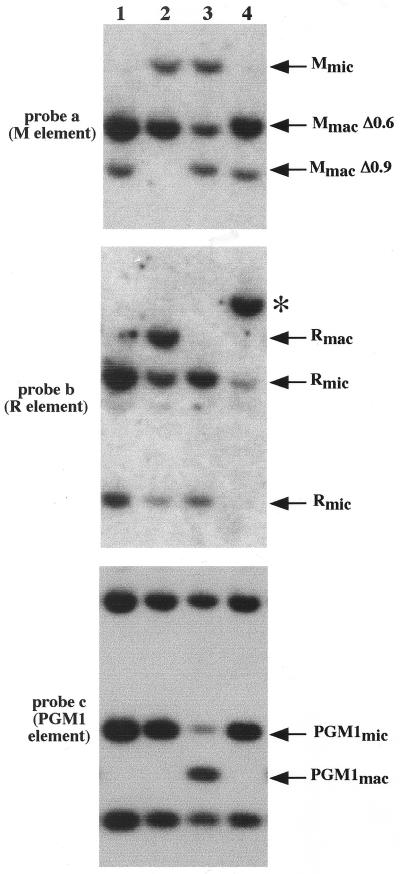
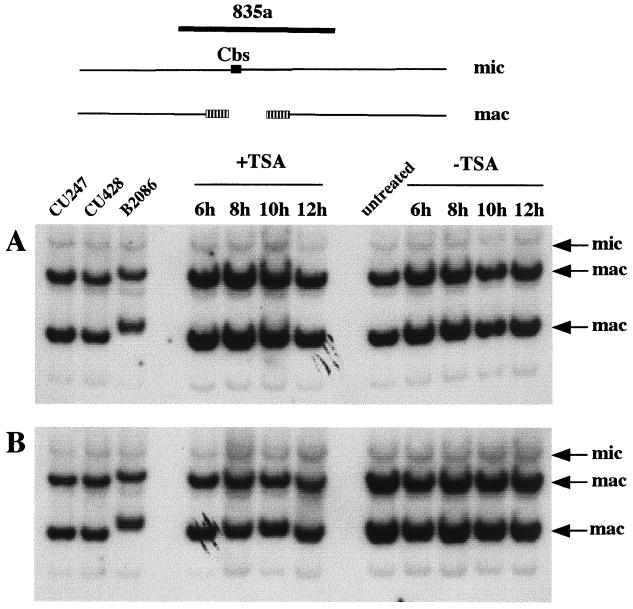
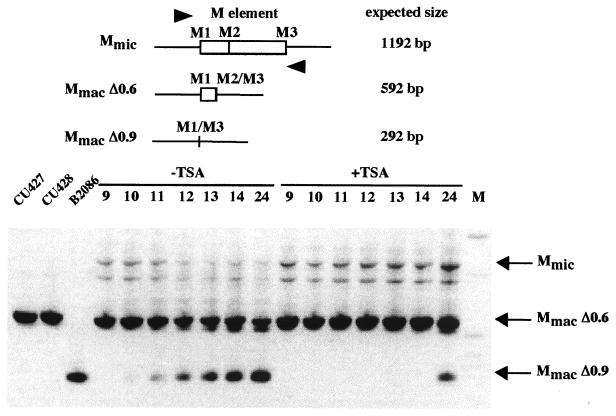
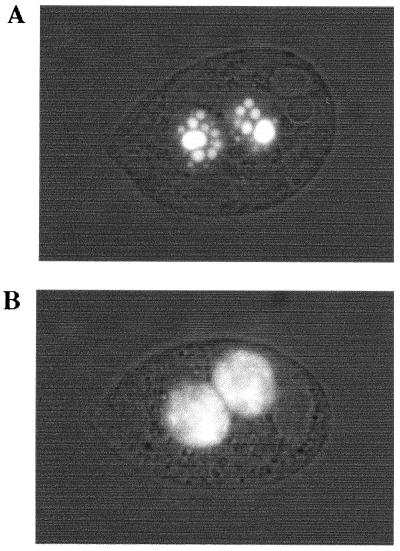
In Tetrahymena, as in other ciliates, development of the somatic macronucleus during conjugation involves extensive and reproducible rearrangements of the germ line genome, including chromosome fragmentation and excision of internal eliminated sequences (IESs). The molecular mechanisms controlling these events are poorly understood. To investigate the role that histone acetylation may play in the regulation of these processes, we treated Tetrahymena cells during conjugation with the histone deacetylase inhibitor trichostatin A (TSA). We show that TSA treatment induces developmental arrests in the early stages of conjugation but does not significantly affect the progression of conjugation once the mitotic divisions of the zygotic nucleus have occurred. Progeny produced from TSA-treated cells were examined for effects on IES excision and chromosome breakage. We found that TSA treatment caused partial inhibition of excision of five out of the six IESs analyzed but did not affect chromosome breakage at four different sites. TSA treatment greatly delayed in some cells and inhibited in most the excision events in the developing macronucleus. It also led to loss of the specialized subnuclear localization of the chromodomain protein Pdd1p that is normally associated with DNA elimination. We propose a model in which underacetylated nucleosomes mark germ line-limited sequences for excision.


Figures

FIG. 1.
FIG. 1.
TSA treatment of conjugating cells at 3 h after mixing causes cells to arrest in metaphase of meiosis I. The developmental stages of conjugation previously described in references and are schematically represented as follows. Lanes: 1, cell pairing; 2, crescent stage (prophase of meiosis I); 3, metaphase of meiosis I; 4, end of meiosis II; 5, prezygotic mitosis of one of the four haploid nuclei; 6, karyogamy; 7, macronuclear development I, which is distinguished by the central location of the parental macronucleus, the anterior location of the new macronuclei, and the posterior location of the new micronuclei; 8, macronuclear development II, in which the parental macronucleus condenses and paired cells separate; 9, macronuclear development III, which begins when the parental macronucleus has been resorbed; 10, the final new macronucleus stage, in which one of the two micronuclei is eliminated and the new macronuclei have undergone DNA amplification. The percentage of cells in each cytological stage was determined after fixing and staining with DAPI. At least 200 pairs were scored for each time point by fluorescence microscopy. About 95% of the cells paired within the first hour after mixing. The white rectangles show the untreated cells. The black rectangles show the outcome for cells treated with TSA at 3 h after mixing for 2 h (until 5 h after mixing) and for 4 h (until 7 h after mixing).
FIG. 2.
FIG. 2.
Genetic analysis of the effects of TSA treatment during conjugation. TSA was added to mating cells at various times (beginning at 3 h and continuing until 12 h after mixing) as indicated in the abscises in both graphs (A and B). The treatment was either for 4 h (triangles) or continued until 24 h after mixing (squares). Control samples are represented by circles. After treatment, individual mating pairs were cloned and the percentages of pairs giving viable cells were scored (A). The percentages of mating pairs that successfully produced sexual progeny (see Materials and Methods) are also given (B). The number of cells analyzed for each point was between 88 and 352. The results are the combined totals of two or more experiments. The discrepancy in the percentage of viability between the 4-h treatment (low viability) and the treatment until 24 h (high viability) for cells treated at 5 h after mixing may be due to bias introduced during cell cloning. At 24 h, many dying or dead cells were already immobile and thus not cloned, which raised the percentage of viable cells among those cloned.
FIG. 3.
FIG. 3.
Maps of the micronuclear and macronuclear versions of the genomic region containing the M and R elements (top panel) and of the genomic region containing the PGM1 element (bottom panel). Micronuclear specific elements are represented by open boxes. The M element is excised from the micronuclear genome in two alternative forms of 0.6kbp (MmacΔ0.6) and 0.9 kbp (MmacΔ0.9). The positions and lengths of probes a, b, and c are shown. HindIII (H) restriction sites are indicated.
FIG. 4.
FIG. 4.
TSA treatment impairs IES excision. Southern hybridization analysis was used to monitor the effect of TSA treatment on the excision of the M, R, and PGM1 elements. Control DNA samples were isolated from vegetative CU427, CU428, and B2086 strains. Experimental DNA samples were isolated from the progeny of cells that were treated at 6 h, 8 h, 10 h, and 12 h after mixing with TSA (+TSA) and without TSA (−TSA) as indicated. Each sample represents a pool of about 100 progeny lines. Total DNA was digested with HindIII. The positions of the DNA fragments corresponding to the unrearranged forms (Mmic, Rmic, and PGM1mic) and the rearranged forms (Mmac, Rmac, and PGM1mac) are indicated by arrows. Among the different HindIII macronuclear fragments revealed by probe c, only the macronuclear fragment containing the PGM1 element is indicated by the arrow as PGM1mac. Conjugating cells were treated for 4 h (A) or continuously until 24 h after mixing (B). The same blot was successively hybridized with probes a, b, and c (Fig. 3) in both panels A and B.
FIG. 5.
FIG. 5.
Effect of TSA treatment on IES excision in individual progeny. The excision of the M, R, and PGM1 elements was analyzed by Southern hybridization in four individual cell lines (lanes 1 to 4) isolated from the sexual progeny of cells treated with TSA from 6 h until 24 h after mixing. Total DNA was digested with HindIII. The same blot was successively hybridized with probes a, b, and c (Fig. 3). The positions of the DNA fragments corresponding to the unrearranged and the rearranged forms of each element are indicated by the arrows. An aberrant form of rearrangement revealed by probe b is marked by an asterisk.
FIG. 6.
FIG. 6.
TSA treatment does not affect chromosome breakage. Southern hybridization analysis was used to monitor chromosome breakage in sexual progeny of cells treated with TSA (+TSA) or without TSA (−TSA) for 4 h (panel A) or until 24 h (panel B). On the schematic representation of chromosome breakage, the 15-bp chromosome breakage site, Cbs, is drawn as a black box. The two macronuclear chromosomes generated after breakage are shown with hatched boxes designating telomeric repeats. All samples were digested with EcoRI. DNA samples in panel A are the same as in Fig. 4A, and DNA samples in panel B are the same as in Fig. 4B. Both blots were hybridized with probe 835a (56). The precise map and sequence of that genomic region have not been determined.
FIG. 7.
FIG. 7.
Timing of excision of the M element in conjugating cells with and without TSA treatment. A schematic diagram of the M element is shown on the top. The oligonucleotides used for PCR are represented by arrowheads. Expected sizes of the PCR products are indicated. PCR products amplified from DNA samples of conjugating cells were run on a 1.2% agarose gel and stained with ethidium bromide. The first three lanes show the results for PCR products amplified from control vegetative cells of CU427, CU428, and B2086 strains. Indicated time points (9, 10, 11, 12, 13, 14, and 24) refer to the times in hours after mixing at which DNAs were extracted from mass mating. TSA was added at 6 h after mixing. M is the 1-kb size marker from Gibco/BRL. Two faint bands were detected in all PCR products amplified from DNA samples of conjugating cells. The uppermost band corresponds to the expected size for Mmic.
FIG. 8.
FIG. 8.
Pdd1p localization in conjugating cells incubated without (A) and with TSA (B). Cells expressing Pdd1p fused to GFP were mated with wild-type cells, and TSA was added at 6 h after mixing. At 14 h after mixing, cells are examined under a fluorescence microscope.

Similar articles

Cited by

References

    1. Almouzni, G., S. Khochbin, S. Dimitrov, and A. P. Wolffe. 1994. Histone acetylation influences both gene expression and development of Xenopus laevis. Dev. Biol. 165:654-669. - PubMed
    1. Asai, D. J., and J. D. Forney. 2000. Tetrahymena thermophila, vol. 62. Academic Press, San Diego, Calif.
    1. Austerberry, C. F., C. D. Allis, and M. C. Yao. 1984. Specific DNA rearrangements in synchronously developing nuclei of Tetrahymena. Proc. Natl. Acad. Sci. USA 81:7383-7387. - PMC - PubMed
    1. Austerberry, C. F., and M. C. Yao. 1987. Nucleotide sequence structure and consistency of a developmentally regulated DNA deletion in Tetrahymena thermophila. Mol. Cell. Biol. 7:435-443. - PMC - PubMed
    1. Austerberry, C. F., and M. C. Yao. 1988. Sequence structures of two developmentally regulated, alternative DNA deletion junctions in Tetrahymena thermophila. Mol. Cell. Biol. 8:3947-3950. - PMC - PubMed

Publication types

MeSH terms