

Isolation and characterization of two ammonium permease genes, meaA and mepA, from Aspergillus nidulans
- PMID: 12455974
- PMCID: PMC118046
- DOI: 10.1128/EC.1.1.85-94.2002
Isolation and characterization of two ammonium permease genes, meaA and mepA, from Aspergillus nidulans
Abstract
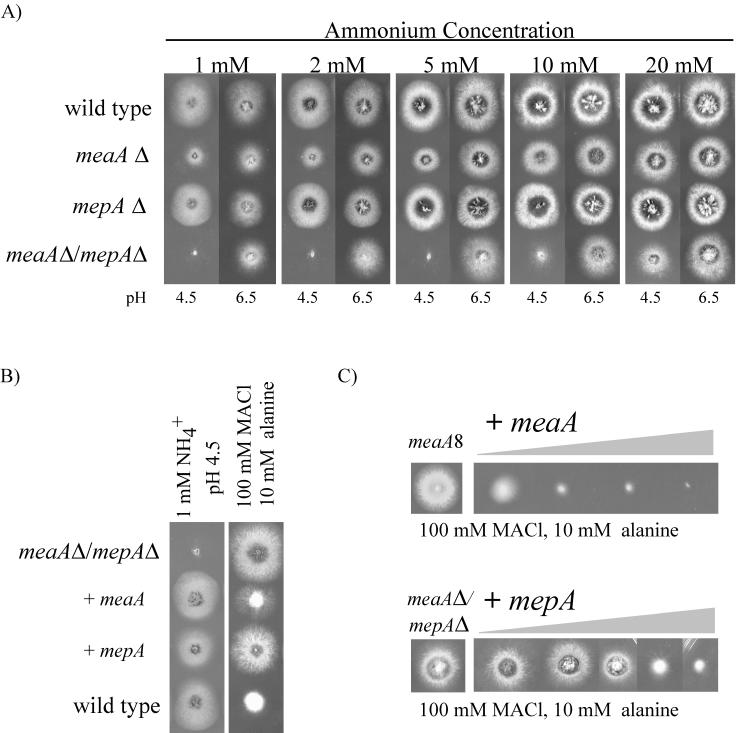
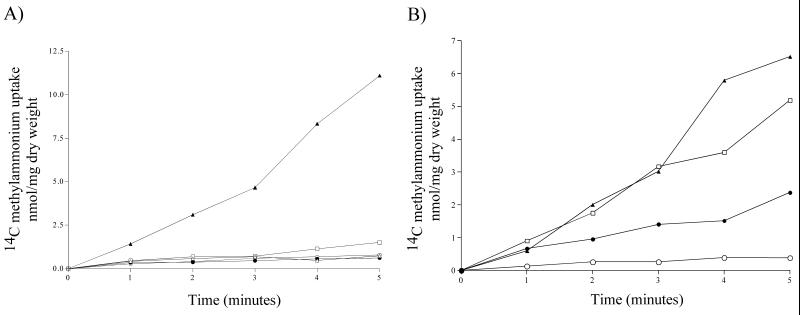
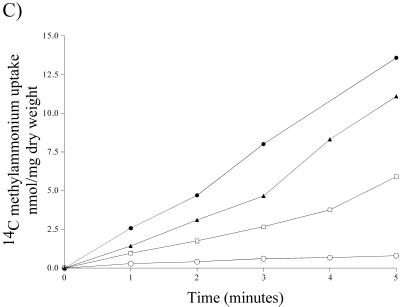
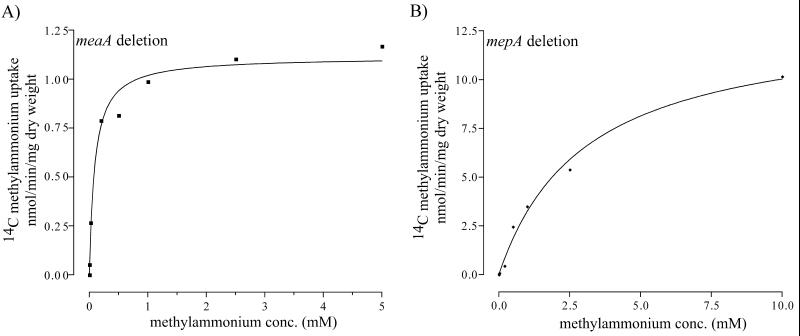
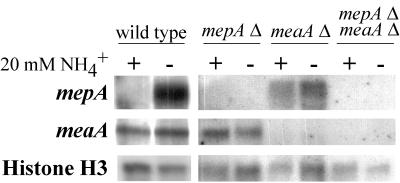
Ammonium and the analogue methylammonium are taken into the cell by active transport systems which constitute a family of transmembrane proteins that have been identified in fungi, bacteria, plants, and animals. Two genes from Aspergillus nidulans, mepA and meaA, which encode ammonium transporters with different affinities have been characterized. The MepA transporter exhibits the highest affinity for methylammonium (Km, 44.3 microM); in comparison, the Km for MeaA is 3.04 mM. By use of targeted gene replacement strategies, meaA and mepA deletion mutants were created. Deletion of both meaA and mepA resulted in the inability of the strain to grow on ammonium concentrations of less than 10 mM. The single meaA deletion mutant exhibited reduced growth at the same concentrations, whereas the mepA deletion mutant displayed wild-type growth. Interestingly, multiple copies of mepA were found to complement the methylammonium resistance phenotype conferred by the deletion of meaA. The expression profiles for mepA and meaA differed; the mepA transcript was detected only in nitrogen-starved cultures, whereas meaA was expressed under both ammonium-sufficient and nitrogen starvation conditions. Together, these results indicate that MeaA constitutes the major ammonium transport activity and is required for the optimal growth of A. nidulans on ammonium as the sole nitrogen source and that MepA probably functions in scavenging low concentrations of ammonium under nitrogen starvation conditions.
Figures
Similar articles
-
Impact of ammonium permeases mepA, mepB, and mepC on nitrogen-regulated secondary metabolism in Fusarium fujikuroi.Eukaryot Cell. 2008 Feb;7(2):187-201. doi: 10.1128/EC.00351-07. Epub 2007 Dec 14. Eukaryot Cell. 2008. PMID: 18083831 Free PMC article.
-
Mutation and functional analysis of the Aspergillus nidulans ammonium permease MeaA and evidence for interaction with itself and MepA.Fungal Genet Biol. 2002 Jun;36(1):35-46. doi: 10.1016/S1087-1845(02)00004-X. Fungal Genet Biol. 2002. PMID: 12051893
-
Differential expression of Aspergillus nidulans ammonium permease genes is regulated by GATA transcription factor AreA.Eukaryot Cell. 2006 Feb;5(2):226-37. doi: 10.1128/EC.5.2.226-237.2006. Eukaryot Cell. 2006. PMID: 16467464 Free PMC article.
-
UreA, the major urea/H+ symporter in Aspergillus nidulans.Fungal Genet Biol. 2010 Dec;47(12):1023-33. doi: 10.1016/j.fgb.2010.07.004. Epub 2010 Jul 12. Fungal Genet Biol. 2010. PMID: 20633690
-
Understanding fungal and plant active urea transport systems: Keys from Aspergillus nidulans and beyond.Biochem Biophys Res Commun. 2024 Nov 26;735:150801. doi: 10.1016/j.bbrc.2024.150801. Epub 2024 Oct 13. Biochem Biophys Res Commun. 2024. PMID: 39437702 Review.
Cited by
-
Metarhizium robertsii ammonium permeases (MepC and Mep2) contribute to rhizoplane colonization and modulates the transfer of insect derived nitrogen to plants.PLoS One. 2019 Oct 16;14(10):e0223718. doi: 10.1371/journal.pone.0223718. eCollection 2019. PLoS One. 2019. PMID: 31618269 Free PMC article.
-
TamA interacts with LeuB, the homologue of Saccharomyces cerevisiae Leu3p, to regulate gdhA expression in Aspergillus nidulans.Mol Genet Genomics. 2004 Nov;272(4):452-9. doi: 10.1007/s00438-004-1073-x. Epub 2004 Oct 27. Mol Genet Genomics. 2004. PMID: 15517391
-
Spontaneous mutations in the ammonium transport gene AMT4 of Chlamydomonas reinhardtii.Genetics. 2005 Jun;170(2):631-44. doi: 10.1534/genetics.105.041574. Epub 2005 Mar 31. Genetics. 2005. PMID: 15802504 Free PMC article.
-
Nucleosome positioning and histone H3 acetylation are independent processes in the Aspergillus nidulans prnD-prnB bidirectional promoter.Eukaryot Cell. 2008 Apr;7(4):656-63. doi: 10.1128/EC.00184-07. Epub 2008 Feb 22. Eukaryot Cell. 2008. PMID: 18296621 Free PMC article.
-
Impact of ammonium permeases mepA, mepB, and mepC on nitrogen-regulated secondary metabolism in Fusarium fujikuroi.Eukaryot Cell. 2008 Feb;7(2):187-201. doi: 10.1128/EC.00351-07. Epub 2007 Dec 14. Eukaryot Cell. 2008. PMID: 18083831 Free PMC article.
References
-
- Arst, H. N., Jr., and D. J. Cove. 1973. Nitrogen metabolite repression in Aspergillus nidulans. Mol. Gen. Genet. 126: 111–141. - PubMed
-
- Arst, H. N., Jr., and M. M. Page. 1973. Mutants of Aspergillus nidulans altered in the transport of methylammonium and ammonium. Mol. Gen. Genet. 121: 239–245.
-
- Bogonez, E., A. Machado, and J. Satrustegui. 1983. Ammonia accumulation in acetate-growing yeast. Biochim. Biophys. Acta 733: 234–241. - PubMed
Publication types
MeSH terms
Substances
LinkOut - more resources
Full Text Sources
Molecular Biology Databases
