. 2002 Jun;1(3):401-13.
doi: 10.1128/EC.1.3.401-413.2002.

Differential modulation of cellular signaling pathways by mild and severe hypovirus strains

Affiliations

Differential modulation of cellular signaling pathways by mild and severe hypovirus strains

Todd B Parsley et al. Eukaryot Cell. 2002 Jun.

Abstract

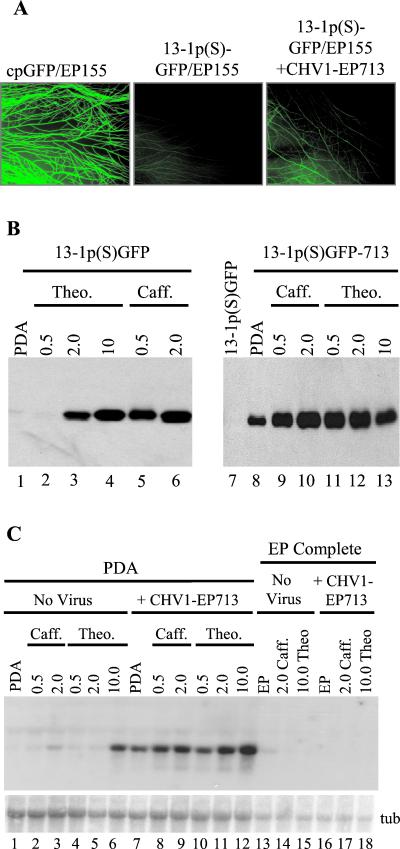
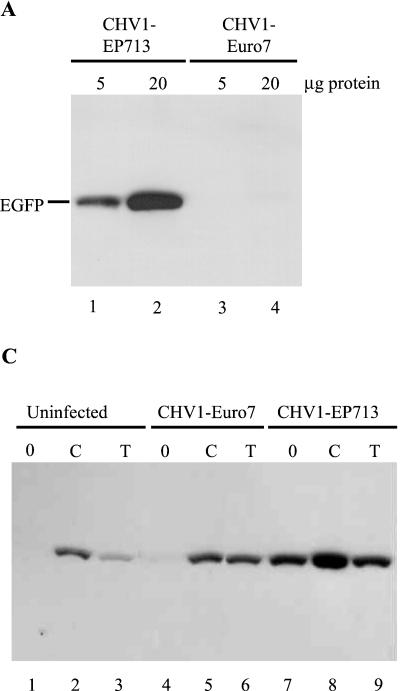
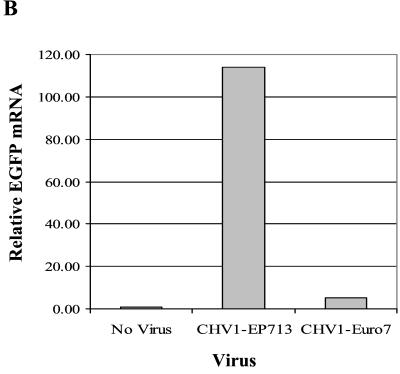
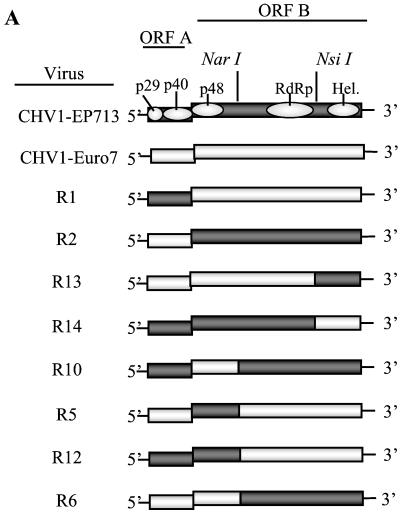
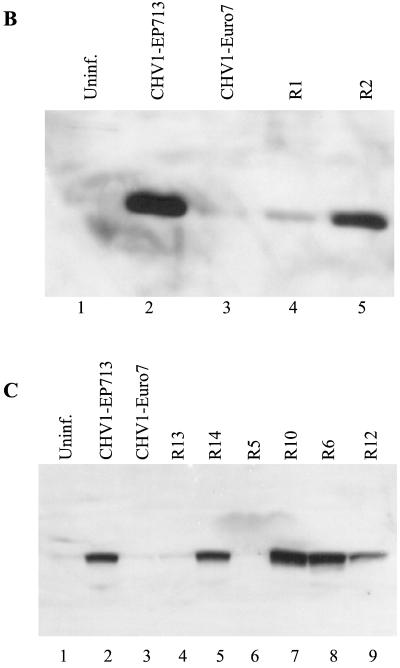
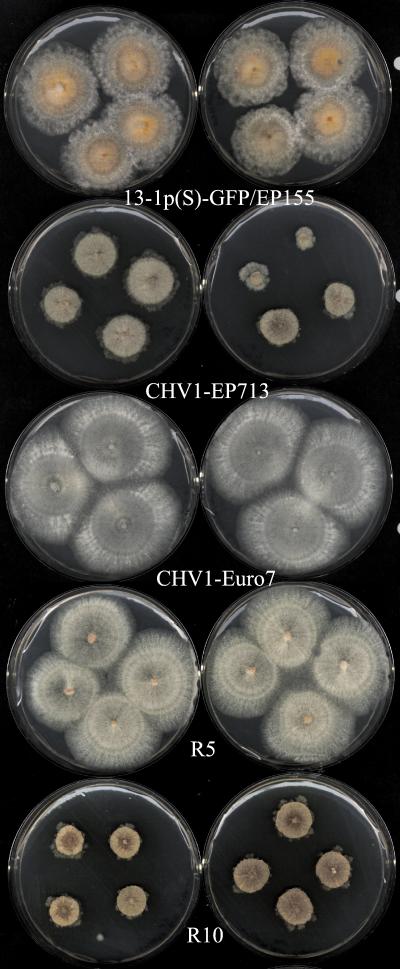
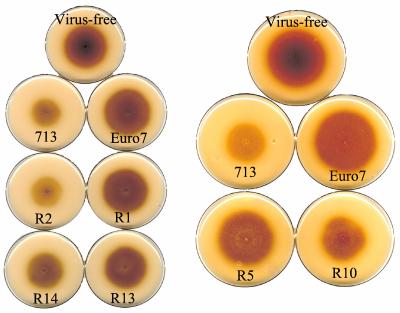
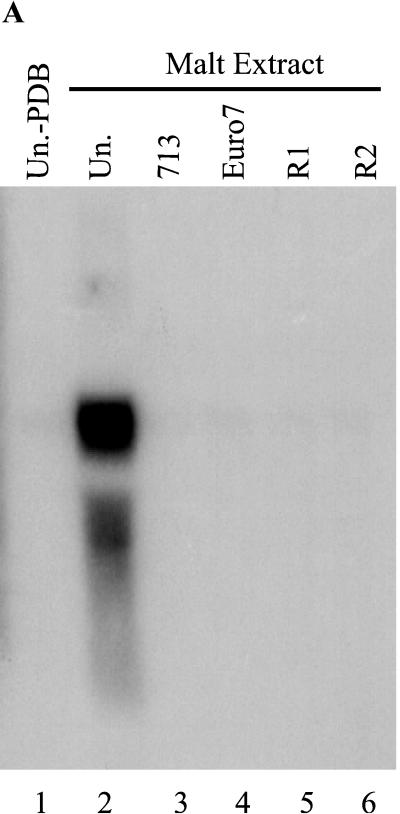
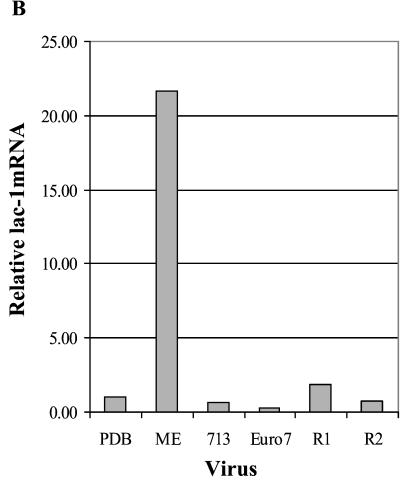
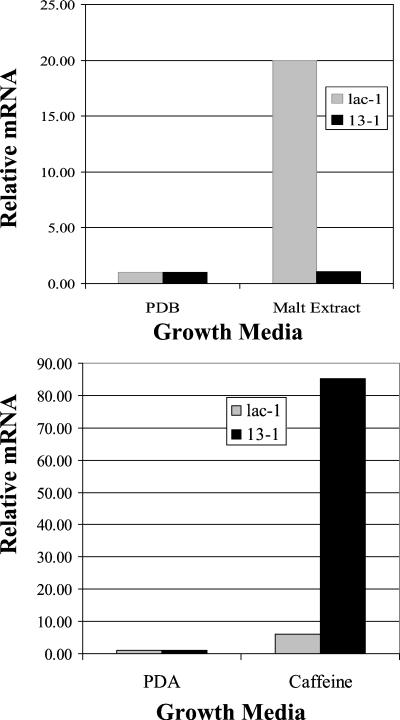
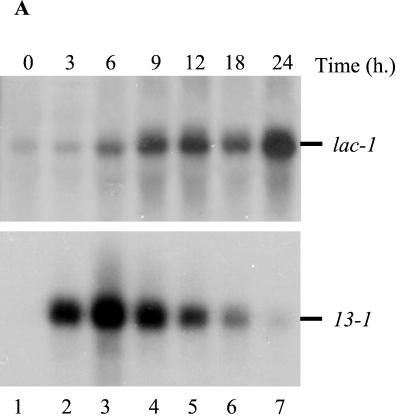
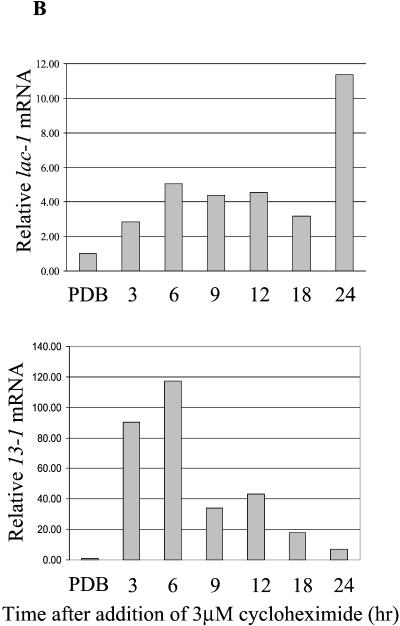
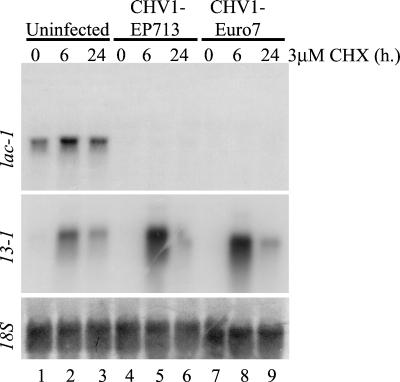
Hypoviruses persistently alter multiple phenotypic traits, stably modify gene expression, and attenuate virulence (hypovirulence) of their pathogenic fungal host, the chestnut blight fungus Cryphonectria parasitica. The pleiotropic nature of these changes is consistent with hypovirus-mediated perturbation of one or more cellular signal transduction pathways. We now report that two hypoviruses that differ in the severity of symptom expression differentially perturb specific cellular signaling pathways. The C. parasitica 13-1 gene, originally identified as a hypovirus-inducible and cyclic AMP (cAMP)-regulated gene, was used to design a promoter-GFP reporter construct with which to monitor perturbation of cAMP-mediated signaling. Virus-mediated modulation of calcium/calmodulin/inositol trisphosphate-dependent signaling was monitored by measuring transcript accumulation from the C. parasitica laccase gene, lac-1. Infection by the severe hypovirus strain CHV1-EP713 caused a substantial induction of 13-1 promoter activity and a reduction of total extracellular laccase enzymatic activity (LAC-1 and LAC-3). In contrast, 13-1 promoter activity and total laccase activity were only marginally altered upon infection with the mild hypovirus strain CHV1-Euro7. However, examination of lac-1-specific transcript accumulation under previously defined culture conditions revealed that both CHV1-EP713 and CHV1-Euro7 perturbed calcium/calmodulin/inositol trisphosphate-dependent signaling. CHV1-EP713/CHV1-Euro7 chimeric viruses were used to map viral determinants responsible for modulation of cAMP-dependent signaling to domains within the central portion of the second open reading frame.


Figures

FIG. 1.
FIG. 1.
Accumulation of EGFP in the C. parasitica transgenic reporter strain 13-1p(S)-GFP/EP155 in response to infection with CHV1-EP713 and/or the presence of the phosphodiesterase inhibitor caffeine (Caff.) or theophylline (Theo.). (A) Green fluorescence analysis of uninfected (center) and CHV1-EP713-infected (right) 13-1p(S)-GFP/EP155 compared with cpGFP/EP155, a transgenic C. parasitica strain containing a copy of the EGFP coding sequences under the transcriptional control of the constitutive C. parasitica gpd promoter (left) (50). All exposure times were standardized to that of the positive control by using the imaging software provided with the Spot 1.3.0 charge-coupled digital device camera. (B) Immunoblot analysis with anti-GFP of uninfected (lanes 1 to 7) or CHV1-EP713-infected (lanes 8 to 13) 13-1p(S)-GFP/EP155 cultured on PDA-cellophane in the absence (lanes 1, 7, and 8) or presence of increasing concentrations of theophylline (lanes 2 to 4 and 11 to 13) or caffeine (lanes 5, 6, 9, and 10). (C) Northern blot analysis of uninfected (lanes 1 to 6 and 13 to 15) or CHV1-EP713-infected (lanes 7 to 12 and 16 to 18) 13-1p(S)-GFP/EP155 cultured on PDA-cellophane (lanes 1 to 12) or EP-complete liquid medium (lanes 13 to 18) in the absence (lanes 1, 7, 13, and 16) or presence of increasing concentrations of caffeine (lanes 2, 3, 8, 9, 14, and 17) or theophylline (lanes 4 to 6, 10 to 12, 15, and 18). For the bottom panel, the membrane was stripped and reprobed for β-tubulin (tub). Concentrations (millimolar) of caffeine and theophylline are indicated above each lane in both panels B and C.
FIG. 2.
FIG. 2.
GFP accumulation in 13-1p(S)-GFP/EP155 infected with CHV1-EP713 or CHV1-Euro7. (A) Immunoblot analysis with anti-GFP of 5 or 10 μg of total protein from 13-1p(S)-GFP/EP155 infected with either CHV1-EP713 (lanes 1 and 2) or CHV1-Euro7 (lanes 3 and 4). (B) Real-time semiquantitative RT-PCR analysis of EGFP mRNA accumulation in uninfected and CHV1-EP713- or CHV1-Euro7-infected 13-1p(S)-GFP/EP155. All values for EGFP mRNA in panel B were normalized to total 18S rRNA in each sample as described in Materials and Methods and are expressed as fold accumulation relative to the amount of EGFP mRNA present in virus-free 13-1p(S)-GFP/EP155. (C) Immunoblot analysis of GFP accumulation in virus-free (lanes 1 to 3), CHV1-Euro7-infected (lanes 4 to 6), or CHV1-EP713-infected (lanes 7 to 9) 13-1p(S)-GFP/EP155 cultured on PDA-cellophane in the absence (0) (lanes 1, 4, and 7) or presence of 2 mM caffeine (C, lanes 2, 5, and 8) or 2 mM theophylline (T, lanes 3, 6, and 9).
FIG. 2.
FIG. 2.
GFP accumulation in 13-1p(S)-GFP/EP155 infected with CHV1-EP713 or CHV1-Euro7. (A) Immunoblot analysis with anti-GFP of 5 or 10 μg of total protein from 13-1p(S)-GFP/EP155 infected with either CHV1-EP713 (lanes 1 and 2) or CHV1-Euro7 (lanes 3 and 4). (B) Real-time semiquantitative RT-PCR analysis of EGFP mRNA accumulation in uninfected and CHV1-EP713- or CHV1-Euro7-infected 13-1p(S)-GFP/EP155. All values for EGFP mRNA in panel B were normalized to total 18S rRNA in each sample as described in Materials and Methods and are expressed as fold accumulation relative to the amount of EGFP mRNA present in virus-free 13-1p(S)-GFP/EP155. (C) Immunoblot analysis of GFP accumulation in virus-free (lanes 1 to 3), CHV1-Euro7-infected (lanes 4 to 6), or CHV1-EP713-infected (lanes 7 to 9) 13-1p(S)-GFP/EP155 cultured on PDA-cellophane in the absence (0) (lanes 1, 4, and 7) or presence of 2 mM caffeine (C, lanes 2, 5, and 8) or 2 mM theophylline (T, lanes 3, 6, and 9).
FIG. 3.
FIG. 3.
Accumulation of GFP in 13-1p(S)-GFP/EP155 infected with CHV1-EP713 and CHV1-Euro7 chimeric viruses. (A) Diagrammatic representation of chimera genomes. Shaded boxes represent portions of the chimera containing CHV1-EP713 sequence. Open boxes represent CHV1-Euro7 sequence. NarI and NsiI restriction sites at nucleotides 5310 and 9897, respectively, used in the engineering of chimeras and virus-encoded protein domains are indicated at the top of the figure (adapted from Chen et al. [13]). (B) Immunoblot analysis with monoclonal anti-GFP of 20 μg of total protein extracted from 13-1p(S)-GFP/EP155 infected with CHV1-EP713 (lane 2), CHV1-Euro7 (lane 3), R1 (lane 4), or R2 (lane 5). Lane 1, 20 μg of total protein from virus-free 13-1p(S)-GFP/EP155. (C) Immunoblot analysis with monoclonal anti-GFP of 20 μg of total protein extracted from 13-1p(S)-GFP/EP155 infected with CHV1-EP713 (lane 2), CHV1-Euro7 (lane 3), R13 (lane 4), R14 (lane 5), R5 (lane 6), R10 (lane 7), R6 (lane 8), or R12 (lane 9). Lane 1, 20 μg of total protein from virus-free 13-1p(S)-GFP/EP155.
FIG. 3.
FIG. 3.
Accumulation of GFP in 13-1p(S)-GFP/EP155 infected with CHV1-EP713 and CHV1-Euro7 chimeric viruses. (A) Diagrammatic representation of chimera genomes. Shaded boxes represent portions of the chimera containing CHV1-EP713 sequence. Open boxes represent CHV1-Euro7 sequence. NarI and NsiI restriction sites at nucleotides 5310 and 9897, respectively, used in the engineering of chimeras and virus-encoded protein domains are indicated at the top of the figure (adapted from Chen et al. [13]). (B) Immunoblot analysis with monoclonal anti-GFP of 20 μg of total protein extracted from 13-1p(S)-GFP/EP155 infected with CHV1-EP713 (lane 2), CHV1-Euro7 (lane 3), R1 (lane 4), or R2 (lane 5). Lane 1, 20 μg of total protein from virus-free 13-1p(S)-GFP/EP155. (C) Immunoblot analysis with monoclonal anti-GFP of 20 μg of total protein extracted from 13-1p(S)-GFP/EP155 infected with CHV1-EP713 (lane 2), CHV1-Euro7 (lane 3), R13 (lane 4), R14 (lane 5), R5 (lane 6), R10 (lane 7), R6 (lane 8), or R12 (lane 9). Lane 1, 20 μg of total protein from virus-free 13-1p(S)-GFP/EP155.
FIG. 4.
FIG. 4.
Phenotypes of 6-day-old PDA-cellophane cultures of virus-free (top) and virus-infected 13-1p(S)-GFP/EP155 (as indicated) mycelia, in duplicate. Plates were scanned on a Hewlett-Packard flat scanner just prior to harvesting of protein for immunoblot analysis.
FIG. 5.
FIG. 5.
Laccase activity of virus-free and hypovirus-infected 13-1p(S)-GFP/EP155 on Bavendamm's medium. Plates were scanned as described for Fig. 4.
FIG. 6.
FIG. 6.
Accumulation of lac-1 transcript in 13-1p(S)-GFP/EP155 grown in 1.5% (wt/vol) malt extract. Uninfected and virus-infected (as indicated at the top of the figure) mycelia were initially cultured in PDB, and then medium was switched to either fresh PDB (lane 1) or 1.5% (wt/vol) malt extract (lanes 2 to 6). Mycelia were harvested for RNA extraction following 12 h of incubation in the dark at room temperature. (A) A total of 10 μg of total RNA was denatured and resolved on a 1% agarose-formaldehyde gel. The RNA was then transferred to a positively charged Nytran membrane and hybridized with a radiolabeled lac-1-specific probe. (B) lac-1 mRNA accumulation was also quantified by real-time RT-PCR by using specific TaqMan probe and primers as described in Materials and Methods. The y axis indicates relative lac-1 accumulation normalized to 18S rRNA.
FIG. 6.
FIG. 6.
Accumulation of lac-1 transcript in 13-1p(S)-GFP/EP155 grown in 1.5% (wt/vol) malt extract. Uninfected and virus-infected (as indicated at the top of the figure) mycelia were initially cultured in PDB, and then medium was switched to either fresh PDB (lane 1) or 1.5% (wt/vol) malt extract (lanes 2 to 6). Mycelia were harvested for RNA extraction following 12 h of incubation in the dark at room temperature. (A) A total of 10 μg of total RNA was denatured and resolved on a 1% agarose-formaldehyde gel. The RNA was then transferred to a positively charged Nytran membrane and hybridized with a radiolabeled lac-1-specific probe. (B) lac-1 mRNA accumulation was also quantified by real-time RT-PCR by using specific TaqMan probe and primers as described in Materials and Methods. The y axis indicates relative lac-1 accumulation normalized to 18S rRNA.
FIG. 7.
FIG. 7.
Real-time semiquantitative RT-PCR analysis of lac-1 and 13-1 transcripts under different growth conditions. Total RNA isolated from virus-free 13-1p(S)-GFP/EP155 cultured in PDB or 1.5% (wt/vol) malt extract for 12 h (upper panel) after an initial incubation in PDB or on PDA plates minus or plus 2 mM caffeine for 6 days (lower panel) was subjected to real-time RT-PCR with lac-1-specific TaqMan probe and primers (light shaded bars) or 13-1-specific TaqMan probe and primers (dark shaded bars).
FIG. 8.
FIG. 8.
Time course analysis of lac-1 and 13-1 transcript accumulation in virus-free 13-1p(S)-GFP/EP155 in response to 3 μM cycloheximide. Individual 50-ml cultures were initially grown in PDB for 48 h at room temperature in the dark and then switched to 50 ml of PDB alone or PDB plus 3 μM cycloheximide. Mycelia was then harvested for RNA extraction at 0, 3, 6, 9, 12, 18, and 24 h after addition of 3 μM cycloheximide. (A) A total of 10 μg of RNA was denatured and resolved on a 1% agarose-formaldehyde gel and transferred to a Nytran-plus membrane. The membrane was initially hybridized with a radiolabeled lac-1-specific probe (upper panel) and then stripped and rehybridized with a 13-1 gene-specific radiolabeled probe (lower panel). (B) Total RNA isolated from the cycloheximide time course was subjected to real-time RT-PCR with lac-1-specific TaqMan probe and primers (upper panel) or 13-1-specific TaqMan probe and primers (lower panel).
FIG. 8.
FIG. 8.
Time course analysis of lac-1 and 13-1 transcript accumulation in virus-free 13-1p(S)-GFP/EP155 in response to 3 μM cycloheximide. Individual 50-ml cultures were initially grown in PDB for 48 h at room temperature in the dark and then switched to 50 ml of PDB alone or PDB plus 3 μM cycloheximide. Mycelia was then harvested for RNA extraction at 0, 3, 6, 9, 12, 18, and 24 h after addition of 3 μM cycloheximide. (A) A total of 10 μg of RNA was denatured and resolved on a 1% agarose-formaldehyde gel and transferred to a Nytran-plus membrane. The membrane was initially hybridized with a radiolabeled lac-1-specific probe (upper panel) and then stripped and rehybridized with a 13-1 gene-specific radiolabeled probe (lower panel). (B) Total RNA isolated from the cycloheximide time course was subjected to real-time RT-PCR with lac-1-specific TaqMan probe and primers (upper panel) or 13-1-specific TaqMan probe and primers (lower panel).
FIG. 9.
FIG. 9.
Accumulation of lac-1 and 13-1 transcripts in uninfected and CHV1-EP713- or CHV1-Euro7-infected 13-1p(S)-GFP/EP155 in response to 3 μM cycloheximide (CHX). Individual 50-ml cultures were initially grown in PDB for 48 h at room temperature in the dark and then switched to 50 ml of PDB alone or PDB plus 3 μM cycloheximide. Mycelium was then harvested for RNA extraction at 0, 6, and 24 h after addition of 3 μM cycloheximide, and 10 μg of RNA was denatured and resolved on a 1% agarose-formaldehyde gel and transferred to a Nytran-plus membrane. The membrane was initially hybridized with a radiolabeled lac-1-specific probe (upper panel) and then stripped and rehybridized with a 13-1 gene-specific radiolabeled probe (middle panel) or an 18S rRNA radiolabeled probe (lower panel).

References

    1. Anagnostakis, S. L. 1982. Biological control of chestnut blight. Science 215:466-471. - PubMed
    1. Anagnostakis, S. L. 1984. Nuclear gene mutations in Endothia (Cryphonectria) parasitica that affect morphology and virulence. Phytopathology 74:561-565.
    1. Anagnostakis, S. L., B. Chen, L. M. Geletka, and D. L. Nuss. 1998. Hypovirus transmission to ascospore progeny by field-released transgenic hypovirulent strains of Cryphonectria parasitica. Phytopathology 88:598-604. - PubMed
    1. Anagnostakis, S. L., and P. R. Day. 1979. Hypovirulence conversion in Endothia parasitica. Phytopathology 69:1226-1229.
    1. Bavendamm, W. 1928. Ueber das Vorkommen und den Nachweis von Oxydasen bei holzzerstörenden Pilzen. Z. Pflanzenschutz 38:257-276.

Publication types

LinkOut - more resources