. 2002 Dec 2;21(23):6409-18.
doi: 10.1093/emboj/cdf629.

Oncostatin M regulates membrane traffic and stimulates bile canalicular membrane biogenesis in HepG2 cells

Affiliations

Oncostatin M regulates membrane traffic and stimulates bile canalicular membrane biogenesis in HepG2 cells

Johanna M van der Wouden et al. EMBO J. .

Abstract

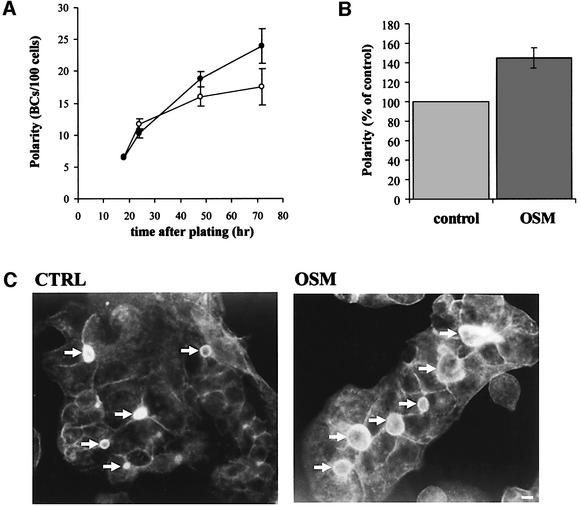
Hepatocytes are the major epithelial cells of the liver and they display membrane polarity: the sinusoidal membrane representing the basolateral surface, while the bile canalicular membrane is typical of the apical membrane. In polarized HepG2 cells an endosomal organelle, SAC, fulfills a prominent role in the biogenesis of the canalicular membrane, reflected by its ability to sort and redistribute apical and basolateral sphingolipids. Here we show that SAC appears to be a crucial target for a cytokine-induced signal transduction pathway, which stimulates membrane transport exiting from this compartment promoting apical membrane biogenesis. Thus, oncostatin M, an IL-6-type cytokine, stimulates membrane polarity development in HepG2 cells via the gp130 receptor unit, which activates a protein kinase A-dependent and sphingomyelin-marked membrane transport pathway from SAC to the apical membrane. To exert its signal transducing function, gp130 is recruited into detergent-resistant membrane microdomains at the basolateral membrane. These data provide a clue for a molecular mechanism that couples the biogenesis of an apical plasma membrane domain to the regulation of intracellular transport in response to an extracellular, basolaterally localized stimulus.


Figures

None
Fig. 1. Treatment of HepG2 cells with the interleukin OSM induces hyperpolarization. (A) Cells were plated at low density onto ethanol sterilized coverslips in culture medium with (closed circle) or without (open circle) 10 ng/ml rhOSM. After several time intervals the cells were fixed in ethanol and stained with phalloidin–TRITC and the nuclear stain Hoechst 33528. Polarity, expressed as BC/cell ratio, was determined as detailed in Materials and methods. (B) HepG2 cells, grown for 72 h on coverslips, were stimulated with or without OSM for 4 h, and the polarity of the culture was determined as described. (C) Fluorescence micrographs of HepG2 cells grown for 72 h in the presence (right) or absence of rhOSM, fixed and stained with phalloidin–TRITC to stain for actin as described. Note the relative increase in number and surface area of the bile canalicular structures (arrows) in cells treated with OSM. Bar is 5 µm.
None
Fig. 2. OSM-induced hyperpolarization does not interfere with the structural and functional integrity of the BC. HepG2 cells were treated with (right) or without (left) OSM for 72 h, fixed and stained for actin with phalloidin–TRITC (A), the tight junction protein ZO-1 (B; red), the apical membrane markers MDR1 (B; green) and Syntaxin 3 (C). To verify the functional integrity following OSM-induced hyperpolarization, HepG2 cells were treated for 72 h with (right) or without (left) the interleukin. The efficiency by which MDR1 removed cell-loaded Rhodamine 123 from treated and non-treated cells, as revealed by pumping of the dye into the BC lumen (D), was then shown as described in Materials and methods. Large arrows mark the bile canalicular (BC) structures, while the small arrows indicate the basolateral membrane of the cells. Bar is 5 µm.
None
Fig. 3. Basolateral-to-apical transcytosis of C6-NBD-SM is stimulated in OSM-treated cells. HepG2 cells were labeled with 4 µm C6-NBD-SM for 30 min at 4°C. Subsequently, the cells were washed and incubated with or without OSM for another 30 min at 4°C. Transport was triggered in the presence or absence of OSM by incubating the cells at 37°C. After different time intervals cells were cooled to block transport and the number of NBD-positive BCs was determined and expressed as percentage of control.
None
Fig. 4. Multiple members of the IL-6 family stimulate polarity development of HepG2 cells through the gp130 signal transducer. Cells were treated with IL-6 (100 U/ml), OSM (10 ng/ml), IL-1β (10 ng/ml) or IL-4 (10 ng/ml) (A), and with the gp130 antagonizing monoclonal antibody AN-H1 (1 µg/ml) or the non-specific basolateral membrane directed antibody CE9 (1 µg/ml) to verify the specificity of signaling through gp130 (B). After 72 h of treatment the cells were fixed and a BC/cell ratio determination was performed as described in Materials and methods.
None
Fig. 5. gp130 is recruited into Triton X-100 insoluble microdomains upon OSM stimulation. (A, B and C) Western blots, showing analyses of Triton X-100 extracts from HepG2 cells, that had been cultured for 72 h and treated with or without OSM for 30 min. Triton X-100 extractions were performed as described in Materials and methods. (A) After Triton X-100 extraction, extracts were centrifuged and supernatants (sup; Triton X-100-soluble) and pellets (pel; Triton X-100-insoluble) were analyzed for gp130. gp130 becomes raft-associated after OSM treatment (upper panel), whereas cholesterol depletion, following treatment with cyclodextrin and lovastatin, precludes gp130 raft association (lower panel). The extracts were also analyzed by sucrose gradient floatation (B and C). Triton X-100 insoluble gp130 is found in fractions 4 and 5 corresponding with the boundary of 5 and 35% sucrose and marked by the presence of a control raft protein, Cav-1, as indicated. As a control for the soluble fractions (8–12), actin was used as a marker. Percentages are expressed as percentage of total gp130 present on the blot. (C) Sucrose density floatation of gp130 after Triton X-100 extraction. Fractions 4 and 5, representing the raft fractions and the non-floating fractions present in the 40% sucrose at the bottom of the gradient (fractions 9–12) were pooled. Equal amounts of protein were loaded on the gels. The upper panel shows the western blot for gp130 in control cells and cells treated with OSM; the lower panel shows gp130 in control and OSM-treated cells after PM cholesterol depletion with cyclodextrin, in the presence of lovastatin. (D) PM cholesterol was depleted by incubation with 10 mM cyclodextrin and lovastatin (CD) whereafter cells were incubated with or without OSM for 4 h. After stimulation the cells were fixed and the BC/cell ratio, as a measure of polarity, was determined.
None
Fig. 6. OSM stimulated hyperpolarity is mediated by endogenous PKA activity. (A) HepG2 cells were cultured for 72 h in the presence or absence of OSM (10 ng/ml), with or without the PKA inhibitor H89 (10 µM). After fixation and staining with phalloidin–TRITC and Hoechst 33528, the BC/cell ratio was determined and expressed as percentage of control. (B) PKA activity in HepG2 cells. After culturing HepG2 cells for 3 days, PKA activity was measured using a PepTag Assay specific for PKA (see Materials and methods). Phosphorylation by PKA of the fluorescently labeled peptide substrate alters the net charge of the peptide from +1 to –1. This change allows separation of the phosphorylated and non-phosphorylated products on an agarose gel. +, anode; –, cathode; positive (pos) and negative (neg) control (see Materials and methods); 1, non-stimulated cells; 2, cells stimulated with OSM for 30 min; 3, cells stimulated with dBcAMP for 30 min. (C) Immunolocalization of PKAR11 in HepG2 cells, cultured with (right) or without (left) OSM for 72 h. Note the close proximity of the centrioles (arrowheads) in OSM-treated cells to the BC. BCs are marked with arrows. Bar is 5 µm.
None
Fig. 7. OSM and dBcAMP redirect SM traffic from SAC towards the BC. (A) The experimental procedure to load C6-NBD-SM into the SAC. At 37°C, cells are labeled and with the fluorescent lipid analog (1), followed by its removal from the basolateral membrane by back-exchange (2). By a subsequent incubation at 18°C, the lipid, present in intracellular transport vesicles and in the bile canalicular membrane, is chased into SAC (3). Residual lipid at the BC is finally ‘depleted’ by quenching with sodium dithionite (4) (see also Materials and methods).  (B) After having the lipid accumulated in SAC, control (closed squares) and cells pretreated with with dBcAMP (1 mM; closed circle) or OSM (10 ng/ml; open circle) were then chased for 20 min at 37°C. Cells had been pretreated with the corresponding compound after step 4 (panel A) for 30 min at 4°C. Note that while in control cells, C6-NBD-SM disappears from the BCP area (panel A, 4), the lipid remains in this region following treatment with either dBcAMP or OSM. In (C) the fractional distribution of C6-NBD-SM, located in the BCP region as determined in panel B, in CTRL, OSM or dBcAMP-treated cells, after a 20 min chase from the SAC, is indicated. Whereas the lipid redistributes over BC and SAC (compare with 4 in panel A) in the treated cells (dBcAMP; OSM), indicative of lipid trafficking in apical direction, no significant increase in labeled lipid is seen at the BC in control cells (CTRL). The latter is consistent with its departure from the BCP region towards the basolateral membrane.

Similar articles

Cited by

References

    1. Aït Slimane T., Trugnan,G., van IJzendorn,S.C.D. and Hoekstra,D. (2003) Raft-mediated trafficking of apical resident proteins occurs in both direct and transcytotic pathways in polarized hepatic cells: role of distinct lipid microdomains. Mol. Biol. Cell,in press. - PMC - PubMed
    1. Babia T., Kok,J.W. and Hoekstra,D. (1994) The use of fluorescent lipid analogues to study endocytosis of glycosphingolipids. In Greenstein,B. (ed.), Receptor Research Methods. Harward Academic Publishers, London, UK, pp. 155–174.
    1. Barasch J. et al. (1999) Mesenchymal to epithelial conversion in rat metanephros is induced by LIF. Cell, 99, 377–386. - PubMed
    1. Brignoni M., Pignataro,O.P., Rodriguez,M.L., Alvarez,A., Vega-Salas,D.E., Rodriguez-Boulan,E. and Salas,P.J. (1995) Cyclic AMP modulates the rate of ‘constitutive’ exocytosis of apical membrane proteins in Madin–Darby canine kidney cells. J. Cell Sci., 108, 1931–1943. - PubMed
    1. Bruce A.G., Hoggatt,I.H. and Rose,T.M. (1992) Oncostatin M is a differentiation factor for myeloid leukemia cells. J. Immunol., 149, 1271–1275. - PubMed