

Evaluation of paediatric osteosarcomas by classic cytogenetic and CGH analyses
- PMID: 12456778
- PMCID: PMC1187277
- DOI: 10.1136/mp.55.6.389
Evaluation of paediatric osteosarcomas by classic cytogenetic and CGH analyses
Abstract
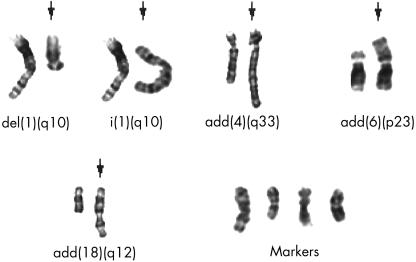
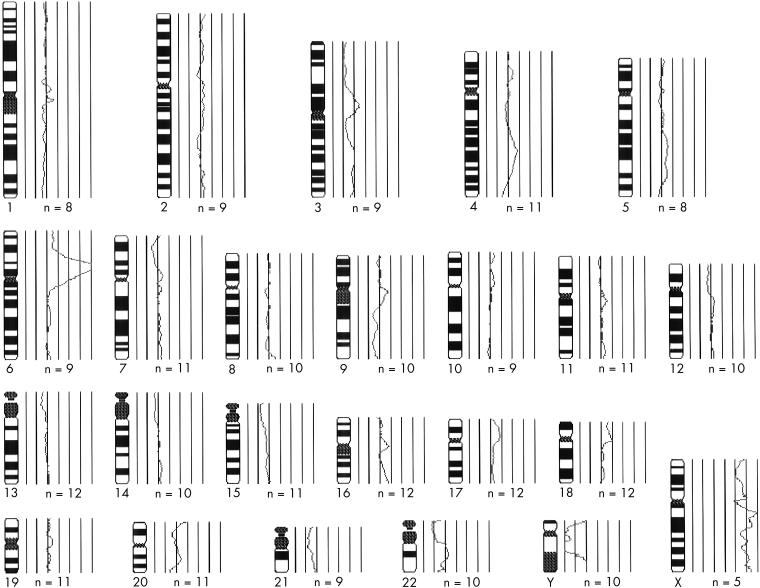
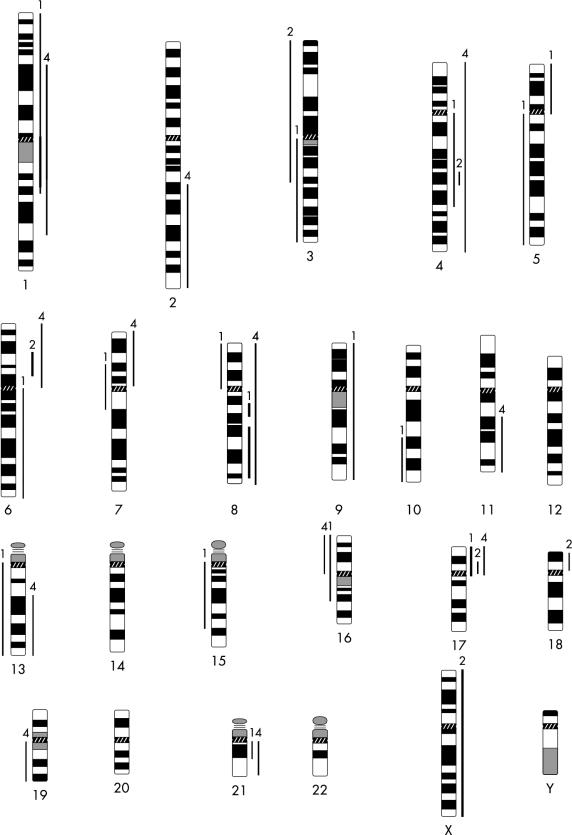
Classic cytogenetic and comparative genomic hybridisation (CGH) data on osteosarcomas have been reported extensively in the literature. However, the number of paediatric osteosarcoma cases studied below the age of 14 years remains relatively small. This study reports four new cases of paediatric osteosarcoma in patients aged 3 to 13 years, evaluated by classic cytogenetics and CGH analyses. Clonal chromosomal alterations were detected in all the cases and included structural rearrangements at 1p11-13, 1q11, 4q27-33, 6p23-25, 6q16-25, 7p13-22, 7q11-36, 11p10-15, 11q23, 17p11.2-13, 21p11, and 21q11-22. The CGH analysis revealed recurrent gains at 1p, 4q, 17p, and 21q and losses at 3q and 16p. Five amplification sites were observed at 1q11-23, 6p21, 8q13, 8q21.3-24.2, and 17p. The data are discussed and compared with other cytogenetic reports in the literature.
Figures
References
-
- Himelstein BP. Osteosarcoma and other bone cancers. Curr Opin Oncol 1998;10:326–33. - PubMed
-
- Mertens F, Mandahl N, Mitelman F, et al. Cytogenetic analysis in the examination of solid tumors in children. Pediatr Hematol Oncol 1994;11:361–77. - PubMed
-
- Biegel JA, Womer RB, Emanuel BS. Complex karyotypes in a series of pediatric osteosarcomas. Cancer Genet Cytogenet 1989;38:89–100. - PubMed
-
- Bridge JA, Nelson M, McComb E, et al. Cytogenetic findings in 73 osteosarcoma specimens and a review of the literature. Cancer Genet Cytogenet 1997;95:74–87. - PubMed
-
- Tarkkanen M, Karhu R, Kallioniemi A, et al. Gains and losses of DNA sequences in osteosarcomas by comparative genomic hybridization. Cancer Res 1995;55:1334–8. - PubMed
MeSH terms
LinkOut - more resources
Full Text Sources
Medical