

Hypotonic treatment evokes biphasic ATP release across the basolateral membrane of cultured renal epithelia (A6)
- PMID: 12456833
- PMCID: PMC2290701
- DOI: 10.1113/jphysiol.2002.026641
Hypotonic treatment evokes biphasic ATP release across the basolateral membrane of cultured renal epithelia (A6)
Abstract
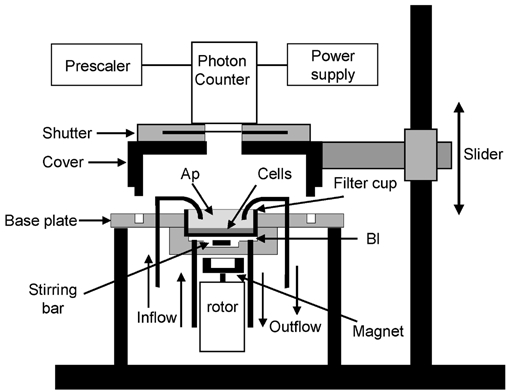
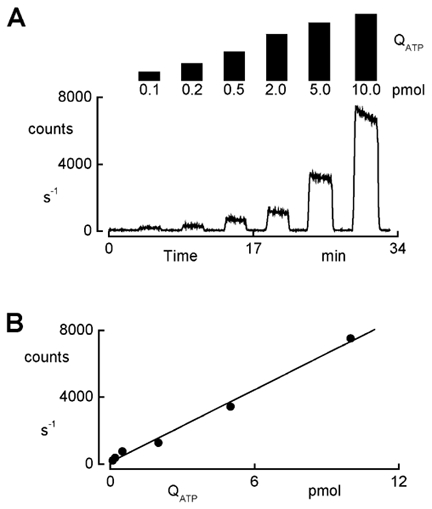
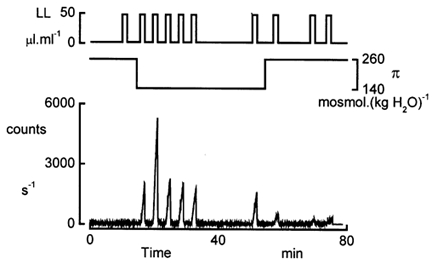
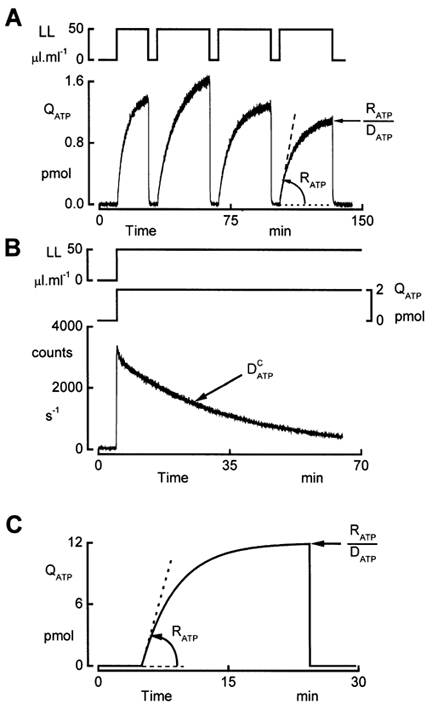
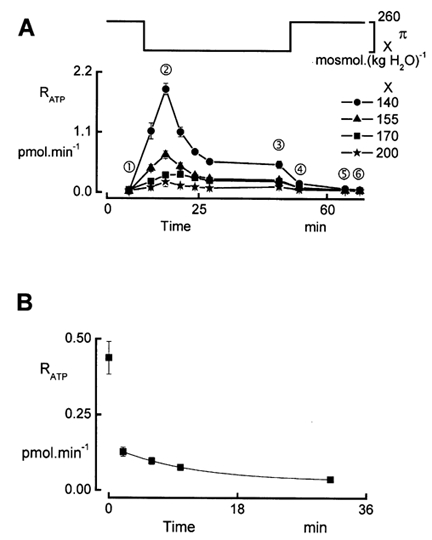
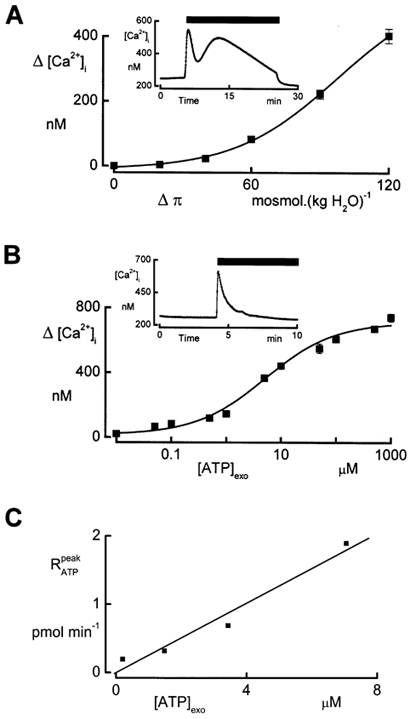
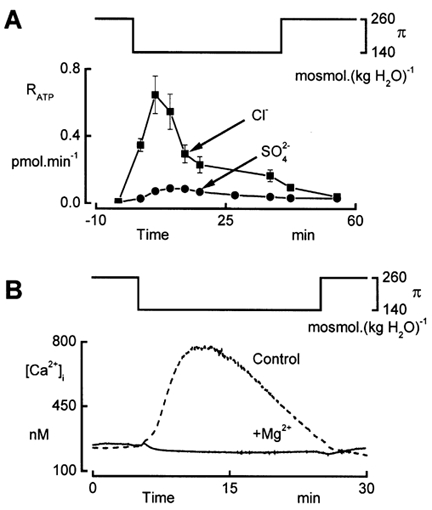
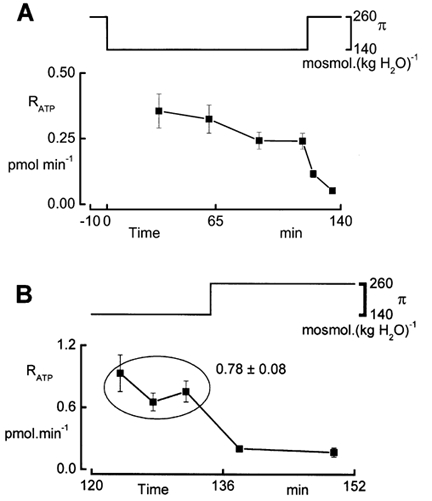
In renal A6 epithelia, an acute hypotonic shock evokes a transient increase in the intracellular Ca(2+) concentration ([Ca(2+)](i)) through a mechanism that is sensitive to the P2 receptor antagonist suramin, applied to the basolateral border only. This finding has been further characterized by examining ATP release across the basolateral membrane with luciferin-luciferase (LL) luminescence. Polarized epithelial monolayers, cultured on permeable supports were mounted in an Ussing-type chamber. We developed a LL pulse protocol to determine the rate of ATP release (R(ATP)) in the basolateral compartment. Therefore, the perfusion at the basolateral border was repetitively interrupted during brief periods (90 s) to measure R(ATP) as the slope of the initial rise in ATP content detected by LL luminescence. Under isosmotic conditions, 1 microl of A6 cells released ATP at a rate of 66 +/- 8 fmol min(-1). A sudden reduction of the basolateral osmolality from 260 to 140 mosmol (kg H(2)O)(-1) elevated R(ATP) rapidly to a peak value of 1.89 +/- 0.11 pmol min(-1) (R(ATP)(peak)) followed by a plateau phase reaching 0.51 +/- 0.07 pmol min(-1) (R(ATP)(plat)). Both R(ATP)(peak) and R(ATP)(plat) values increased with the degree of dilution. The magnitude of R(ATP)(plat) remained constant as long as the hyposmolality was maintained. Similarly, a steady ATP release of 0.78 +/- 0.08 pmol min(-1) was recorded after gradual dilution of the basolateral osmolality to 140 mosmol (kg H(2)O)(-1). This R(ATP) value, induced in the absence of cell swelling, is comparable to R(ATP)(plat). Therefore, the steady ATP release is unrelated to membrane stretching, but possibly caused by the reduction of intracellular ionic strength during cell volume regulation. Independent determinations of dose-response curves for peak [Ca(2+)](i) increase in response to exogenous ATP and basolateral hyposmolality demonstrated that the exogenous ATP concentration, required to mimic the osmotic reduction, was linearly correlated with R(ATP)(peak). The link between the ATP release and the fast [Ca(2+)](i) transient was also demonstrated by the depression of both phenomena by Cl(-) removal from the basolateral perfusate. The data are consistent with the notion that during hypotonicity, basolateral ATP release activates purinergic receptors, which underlies the suramin-sensitive rise of [Ca(2+)](i) during the hyposmotic shock.
Figures
Similar articles
-
Modeling of basolateral ATP release induced by hypotonic treatment in A6 cells.Eur Biophys J. 2004 Aug;33(5):412-20. doi: 10.1007/s00249-003-0375-y. Epub 2004 Jan 9. Eur Biophys J. 2004. PMID: 14714153
-
Mg(2+)-sensitive non-capacitative basolateral Ca(2+) entry secondary to cell swelling in the polarized renal A6 epithelium.J Physiol. 2002 May 15;541(Pt 1):91-101. doi: 10.1113/jphysiol.2001.013199. J Physiol. 2002. PMID: 12015422 Free PMC article.
-
Hypotonicity-induced ATP release is potentiated by intracellular Ca2+ and cyclic AMP in cultured human bronchial cells.Jpn J Physiol. 2003 Oct;53(5):319-26. doi: 10.2170/jjphysiol.53.319. Jpn J Physiol. 2003. PMID: 14975177
-
Control of epithelial transport via luminal P2 receptors.Am J Physiol Renal Physiol. 2003 Mar;284(3):F419-32. doi: 10.1152/ajprenal.00075.2002. Am J Physiol Renal Physiol. 2003. PMID: 12556361 Review.
-
Lytic Release of Cellular ATP: Physiological Relevance and Therapeutic Applications.Life (Basel). 2021 Jul 16;11(7):700. doi: 10.3390/life11070700. Life (Basel). 2021. PMID: 34357072 Free PMC article. Review.
Cited by
-
Aldosterone acts via an ATP autocrine/paracrine system: the Edelman ATP hypothesis revisited.Proc Natl Acad Sci U S A. 2005 Oct 18;102(42):15000-5. doi: 10.1073/pnas.0507008102. Epub 2005 Oct 17. Proc Natl Acad Sci U S A. 2005. PMID: 16230642 Free PMC article.
-
Sequential activation of RhoA and FAK/paxillin leads to ATP release and actin reorganization in human endothelium.J Physiol. 2004 Jul 15;558(Pt 2):479-88. doi: 10.1113/jphysiol.2004.065334. Epub 2004 May 21. J Physiol. 2004. PMID: 15155793 Free PMC article.
-
An intact kidney slice model to investigate vasa recta properties and function in situ.Nephron Physiol. 2012;120(3):p17-31. doi: 10.1159/000339110. Epub 2012 Jul 20. Nephron Physiol. 2012. PMID: 22833057 Free PMC article.
-
Sympathetic nerve-derived ATP regulates renal medullary vasa recta diameter via pericyte cells: a role for regulating medullary blood flow?Front Physiol. 2013 Oct 29;4:307. doi: 10.3389/fphys.2013.00307. eCollection 2013. Front Physiol. 2013. PMID: 24194721 Free PMC article.
-
Modeling of basolateral ATP release induced by hypotonic treatment in A6 cells.Eur Biophys J. 2004 Aug;33(5):412-20. doi: 10.1007/s00249-003-0375-y. Epub 2004 Jan 9. Eur Biophys J. 2004. PMID: 14714153
References
-
- Atia F, Zeiske W, Van Driessche W. Secretory apical Cl− channels in A6 cells: possible control by cell Ca2+ and cAMP. Pflügers Archiv. 1999;438:344–353. - PubMed
-
- Boudreault F, Grygorczyk R. Cell swelling-induced ATP release and gadolinium-sensitive channels. American Journal of Physiology - Cell Physiology. 2002;282:C219–226. - PubMed
-
- Braunstein GM, Roman RM, Clancy JP, Kudlow BA, Taylor AL, Shylonsky VG, Jovov B, Peter K, Jilling T, Ismailov Ii, Benos, D J, Schwiebert, L M, Fitz, J G, Schwiebert EM. Cystic fibrosis transmembrane conductance regulator facilitates ATP release by stimulating a separate ATP release channel for autocrine control of cell volume regulation. Journal of Biological Chemistry. 2001;276:6621–6630. - PubMed
-
- Burnstock G, Williams M. P2 purinergic receptors: modulation of cell function and therapeutic potential. Journal of Pharmacology and Experimental Therapeutics. 2000;295:862–869. - PubMed
-
- Cannon CL, Basavappa S, Strange K. Intracellular ionic strength regulates the volume sensitivity of a swelling-activated anion channel. American Journal of Physiology. 1998;275:C416–422. - PubMed
Publication types
MeSH terms
Substances
Grants and funding
LinkOut - more resources
Full Text Sources
Miscellaneous