Clinical Trial
. 2002 Dec 1;545(2):681-95.
doi: 10.1113/jphysiol.2002.026948.

Motor unit synchronisation is enhanced during slow lengthening contractions of a hand muscle

Affiliations
Clinical Trial

Motor unit synchronisation is enhanced during slow lengthening contractions of a hand muscle

John G Semmler et al. J Physiol. .

Abstract

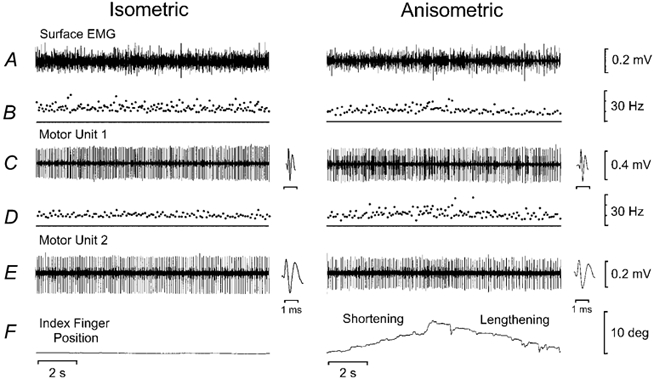
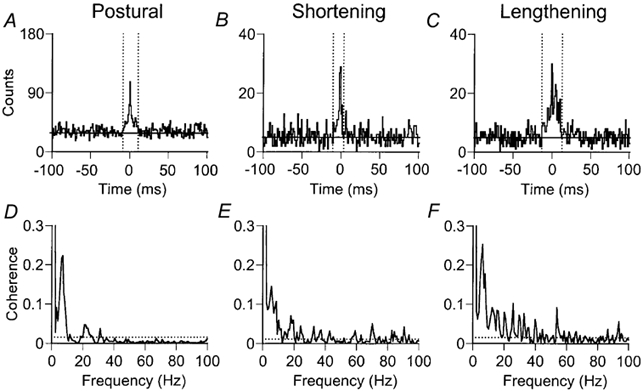
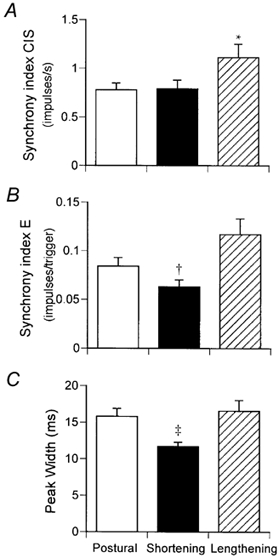
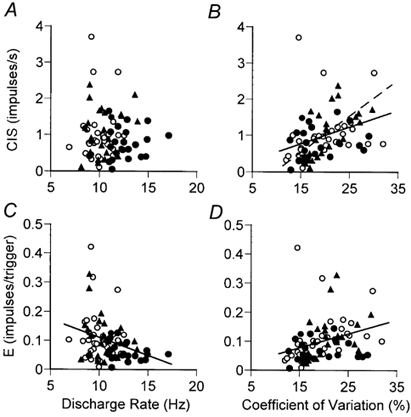
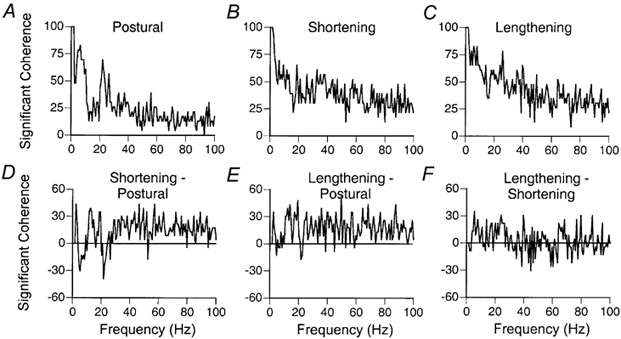
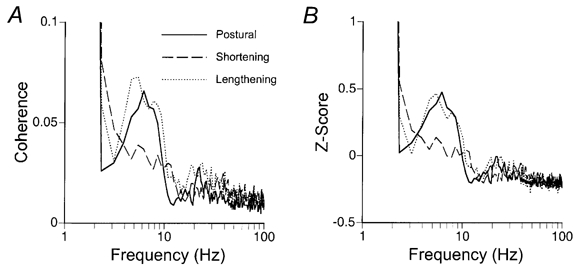
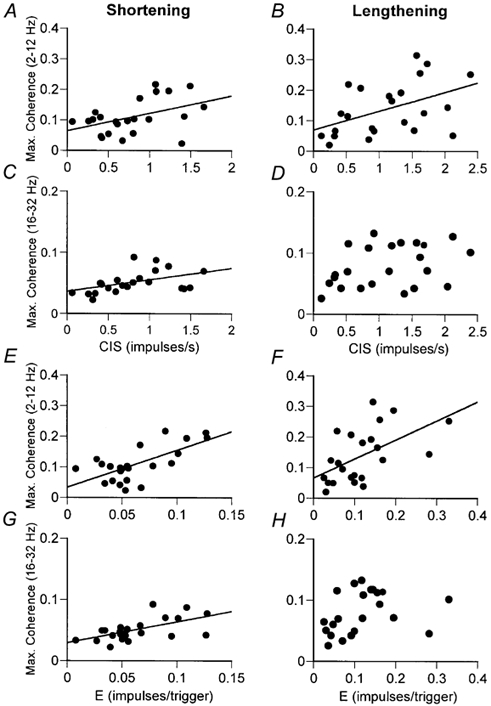
This study examined the strength of motor unit synchronisation based on time- and frequency-domain measures during postural, shortening and lengthening contractions of a hand muscle in young adults. Single motor unit activity was recorded with intramuscular electrodes in the left first dorsal interosseus muscle as the subject held the index finger at a constant position while supporting a light load for 2-5 min. The subject then performed slow (1.7 deg s(-1)) shortening and lengthening contractions to lift and lower the load. The movement required subjects to perform 10-25 constant-velocity contractions with the index finger over a 10 deg range of motion by using 6 s shortening and lengthening contractions. Individual discharge times were obtained from 23 pairs of motor units in 14 subjects to assess the strength of motor unit synchronisation and coherence during the three tasks. The strength of motor unit synchronisation was approximately 50 % greater during the lengthening contractions compared with the postural and shortening contractions, and the width of the central synchronous peak in the cross-correlation histogram was approximately 4 ms narrower during shortening contractions. These findings reveal that there is an increase in common input to motoneurones during lengthening contractions and a greater relative contribution of direct common inputs to motoneurones during shortening contractions compared with postural tasks. Furthermore, the amount of motor unit coherence in the low-frequency band (2-12 Hz) was reduced during shortening contractions compared with postural and lengthening contractions. These data indicate that the timing of inputs received by the motoneurones innervating the first dorsal interosseus of young adults differs during postural, shortening and lengthening contractions against a light load.


Figures

Figure 1
Figure 1. Single motor unit and performance data during postural and anisometric contractions in one subject
Recordings from two motor units during postural (position hold) and anisometric (shortening and lengthening) contractions. A, surface EMG for the first dorsal interosseus muscle. B, instantaneous discharge rate for motor unit 1. Mean discharge rate was 13.4 Hz for the postural contraction, 11.1 Hz for the shortening contractions and 9.6 Hz for the lengthening contractions. Mean coefficient of variation (CV) of discharge rate was 20.8 % for the postural contraction, 24.1 % for the shortening contractions and 25.3 % for the lengthening contractions. C, recording of motor unit 1 with insets showing the motor unit waveforms. D, instantaneous discharge rate for motor unit 2. Mean discharge rate was 10.8 Hz for the postural contraction, 10.5 Hz for the shortening contractions and 8.5 Hz for the lengthening contractions. Mean CV of discharge rate was 22.3 % for the postural contraction, 20.9 % for the shortening contractions and 20.2 % for the lengthening contractions. E, recording of motor unit 2 with insets showing the motor unit waveforms. F, position of the index finger with the baseline indicating 5 deg of abduction.
Figure 2
Figure 2. Examples of cross-correlation and coherence analysis from 1 motor unit pair during the three tasks
Cross-correlograms (A-C) and motor unit coherence (D-F) from the two motor units shown in Fig. 1. Data were obtained from the same pair of motor units during postural (A and D), shortening (B and E) and lengthening (C and F) contractions. A-C, the significant central peak in each correlogram indicates the strength of motor unit synchronisation. The horizontal line represents the mean number of counts outside the central peak. The dotted vertical lines denote the width of the central synchronous peak as determined from the cusum. For this subject, the strength of motor unit synchronisation was greatest during the lengthening contractions, although the width of the central synchronous peak was narrowest during shortening contractions. D-F, although significant coherence is observed at low frequencies (0-10 Hz) for all three tasks, the peak amplitude of the coherence was weaker in the shortening contractions (0.15 at 5.4 Hz) compared with the postural (0.22 at 7.0 Hz) and lengthening (0.25 at 6.2 Hz) contractions. The incidence of significant coherence across the spectrum was greater for shortening and lengthening contractions. The dotted horizontal line represents the 95 % confidence interval.
Figure 3
Figure 3. Motor unit synchronisation during postural, shortening and lengthening contractions
The mean (± s.e.m.) strength of motor unit synchronisation based on the index CIS (A) and index E (B) and the width of the central synchronous peak (C) in 23 motor unit pairs during the different contractions. * P < 0.05 compared with postural and shortening contractions. † P < 0.05 compared with postural contractions and P < 0.01 compared with lengthening contractions. ‡ P < 0.05 compared with lengthening contractions.
Figure 4
Figure 4. Relations between motor unit synchronisation and discharge characteristics
The synchrony index CIS (A and B) and synchrony index E (C and D) are plotted against the geometric mean discharge rate (A and C) and the geometric mean of the coefficient of variation for discharge rate (B and D) of the motor unit pairs contributing to the cross-correlogram during postural (○), shortening (•), and lengthening (▴) contractions. Linear regression revealed a weak negative correlation between the synchrony index E and motor unit discharge rate for all motor units (fitted line in C; r2 + 0.09, P < 0.01), whereas an association was not observed between the synchrony index CIS and discharge rate (A). There was a positive relation between the synchrony index CIS and coefficient of variation for discharge rate (B) for all motor units (continuous line in B; r2 + 0.12, P < 0.01) and for lengthening contractions (dashed line in B; r2 + 0.35, P < 0.01). Similarly, there was a positive relation between the synchrony index E and the coefficient of variation for discharge rate for all motor units (fitted line in D; r2 + 0.10, P < 0.01).
Figure 5
Figure 5. The incidence of significant coherence during postural, shortening and lengthening contractions
A-C, the percentage of all motor unit pairs showing significant coherence as a function of frequency during postural, shortening and lengthening contractions. D-F, the difference in the incidence of significant coherence between shortening and postural contractions, lengthening and postural contractions, and lengthening and shortening contractions. There was a greater incidence of significant coherence for the shortening and lengthening contractions compared with postural contractions.
Figure 6
Figure 6. The strength of coherence during postural, shortening and lengthening contractions
Mean (A) and normalized (B) strength of coherence as a function of frequency for 23 motor unit pairs recorded during postural (continuous line), shortening (dashed line) and lengthening (dotted line) contractions. The data were plotted on a log-linear scale to emphasise the differences in coherence within the low- (2-12 Hz) frequency band. The strength of coherence was reduced in the shortening contractions compared with the postural and lengthening contractions between 5 and 8 Hz. There was no difference in the strength of coherence between the different contractions at higher frequencies.
Figure 7
Figure 7. Relation between motor unit synchronisation and coherence during shortening and lengthening contractions
The synchrony index CIS (A-D) and index E (E-H) are plotted against the maximum value of coherence in the 2-12 Hz (A and B; E and F) and 16-32 Hz (C and D; G and H) frequency bands for each motor unit pair during shortening and lengthening contractions. The significant linear relations are for motor units from shortening contractions in the 2-12 Hz and 16-32 Hz frequency range (r2 values of 0.20-0.45), and lengthening contractions in the 2-12 Hz range only (r2 values of 0.22-0.30). For all tasks (data not shown), the strongest relations were observed between the synchrony index E and maximum coherence in the 2-12 Hz frequency band.

Similar articles

Cited by

References

    1. Andres FG, Mima T, Schulman AE, Dichgans J, Hallett M, Gerloff C. Functional coupling of human cortical sensorimotor areas during bimanual skill acquisition. Brain. 1999;122:855–870. - PubMed
    1. Baker JR, Bremner FD, Cole JD, Stephens JA. Short-term synchronization of intrinsic hand muscle motor units in a ‘deafferented’ man. Journal of Physiology. 1988;396:155P. - PubMed
    1. Baker SN, Kilner JM, Pinches EM, Lemon RN. The role of synchrony and oscillations in the motor output. Experimental Brain Research. 1999;128:109–117. - PubMed
    1. Baker SN, Olivier E, Lemon RN. Coherent oscillations in monkey motor cortex and hand muscle EMG show task-dependent modulation. Journal of Physiology. 1997;501:225–241. - PMC - PubMed
    1. Brown P. Muscle sound during human wrist movements. Journal of Physiology. 1996;494P:68P.

Publication types

LinkOut - more resources