. 2002 Dec 10;99(25):15898-903.
doi: 10.1073/pnas.252637799. Epub 2002 Nov 27.

Trehalose accumulation in rice plants confers high tolerance levels to different abiotic stresses

Affiliations

Trehalose accumulation in rice plants confers high tolerance levels to different abiotic stresses

Ajay K Garg et al. Proc Natl Acad Sci U S A. .

Abstract

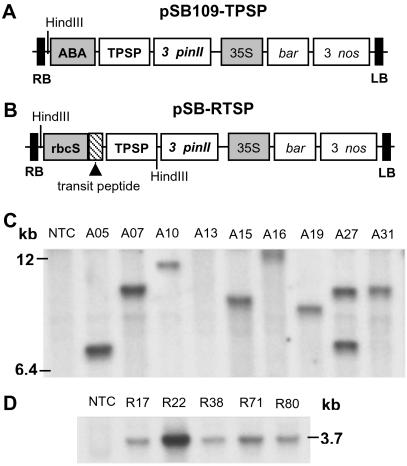
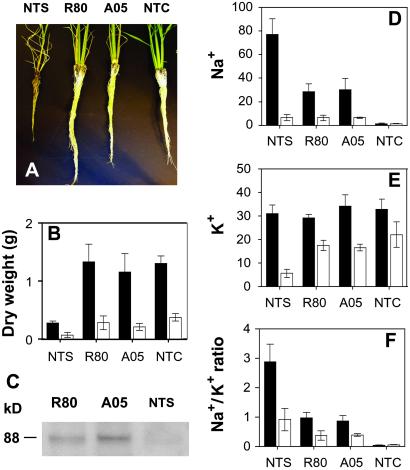
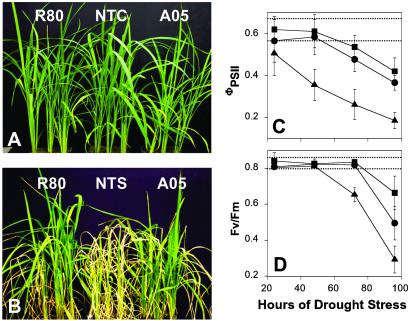
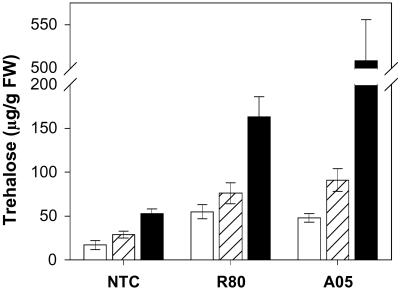
Trehalose is a nonreducing disaccharide of glucose that functions as a compatible solute in the stabilization of biological structures under abiotic stress in bacteria, fungi, and invertebrates. With the notable exception of the desiccation-tolerant "resurrection plants," trehalose is not thought to accumulate to detectable levels in most plants. We report here the regulated overexpression of Escherichia coli trehalose biosynthetic genes (otsA and otsB) as a fusion gene for manipulating abiotic stress tolerance in rice. The fusion gene has the advantages of necessitating only a single transformation event and a higher net catalytic efficiency for trehalose formation. The expression of the transgene was under the control of either tissue-specific or stress-dependent promoters. Compared with nontransgenic rice, several independent transgenic lines exhibited sustained plant growth, less photo-oxidative damage, and more favorable mineral balance under salt, drought, and low-temperature stress conditions. Depending on growth conditions, the transgenic rice plants accumulate trehalose at levels 3-10 times that of the nontransgenic controls. The observation that peak trehalose levels remain well below 1 mgg fresh weight indicates that the primary effect of trehalose is not as a compatible solute. Rather, increased trehalose accumulation correlates with higher soluble carbohydrate levels and an elevated capacity for photosynthesis under both stress and nonstress conditions, consistent with a suggested role in modulating sugar sensing and carbohydrate metabolism. These findings demonstrate the feasibility of engineering rice for increased tolerance of abiotic stress and enhanced productivity through tissue-specific or stress-dependent overproduction of trehalose.


Figures

Fig 1.
Fig 1.
Schematic representation of the expression vectors and DNA-blot hybridization analysis. Two binary plasmids, each containing the trehalose biosynthetic fusion gene (TPSP) that includes the coding regions of the E. coli otsA and otsB genes (encoding TPS and TPP, respectively), were constructed and transformed into indica rice, as described in Materials and Methods. (A) pSB109-TPSP plasmid. (B) pSB-RTSP plasmid. Shaded boxes represent promoter elements (ABA, ABA-inducible; rbcS, rice rbcS; 35S, cauliflower mosaic virus 35S); RB and LB represent T-DNA border on the right and left sides, respectively. Shown is DNA-blot hybridization analysis from nontransformed control (NTC) plant, and representative transgenic plants of nine A-lines (C) and five R-lines (D) that were transformed with the plasmid pSB109-TPSP and pSB-RTSP, respectively. The rice genomic DNA was digested with HindIII (a unique site in the plasmid pSB109-TPSP, whereas two sites are present in the plasmid pSB-RTSP) and DNA blot hybridization analysis was performed with the 2.2-kb TPSP fusion gene as the probe. Molecular sizes (kb) are indicated.
Fig 2.
Fig 2.
Salt tolerance of rice plants and changes in mineral nutrition caused by salt stress. (A) Plant roots after 4 weeks of continuous 100 mM NaCl stress; the plants were not stressed in NTC. (B) Dry weight of shoots (black bars) and roots (white bars) of plants grown under salt stress (NTS, R80, and A05) or no stress (NTC) conditions. (C) Western blots of leaf extracts (20 μg of proteins) immediately after salt stress of plants. (DF) Plant mineral nutrient content in shoots (black bars) and roots (white bars) under salt stress (NTS, R80, and A05) or no stress (NTC) conditions. (D) Na+. (E) K+. (F) Na+/K+ ratio. The ionic concentration is presented as mg/g dry weight. Values are the means ± SD (n = 5).
Fig 3.
Fig 3.
Appearance of plants and chlorophyll fluorescence parameters during drought stress. Five-week-old nontransformed and T4 generation transgenic (R80 and A05) seedlings grown in soil were subjected to two cycles of 100 h of drought stress followed by watering for 3 weeks. (A) Plants grown under well watered conditions (NTC, nontransgenic plants). (B) Plants of the same age after two cycles of drought-stress treatment (NTS, nontransgenic plants after drought stress). (C and D) Chlorophyll fluorescence measurements on young, fully expanded leaves during the first cycle of 100 h of continuous drought stress. (C) ΦPSII, a measure of the efficiency of PS II photochemistry under ambient growth conditions. (D) Decreases in Fv/Fm are a measure of photooxidative damage to PS II. ▴, nontransformed plants; ▪, R80; •, A05. Dotted lines represent the range of values for nonstressed control plants of all lines. Data represent means ± SD (n = 5) from independent plants.
Fig 4.
Fig 4.
Trehalose content in shoots of transgenic (R80 and A05) and nontransgenic plants with or without stress. Trehalose accumulation under nonstressed (white bars), salt-stressed (100 mM NaCl for 4 weeks, hatched bars), or drought-stressed (100 h, black bars) conditions.
Fig 5.
Fig 5.
Photosystem II electron transport rate in nontransformed and two independent, fifth generation transgenic plants grown under control conditions. The electron transport rate under increasing irradiance was calculated from chlorophyll fluorescence measurements on the youngest fully expanded leaf of NTC (▴), R80 (▪), and A05 (•) at 360 ppm of CO2, 25°C, and 50% relative humidity after 10 weeks of growth. Values are the means ± SD (n = 9). Data are normalized to the average light-saturated rate of the nontransgenic control plants.

Similar articles

Cited by

References

    1. Boyer J. S. (1982) Science 218, 443-448. - PubMed
    1. Zhang H. X., Hodson, J. N., Williams, J. P. & Blumwald, E. (2001) Proc. Natl. Acad. Sci. USA 98, 12832-12836. - PMC - PubMed
    1. Hare P. D., Cress, W. A. & van Staden, J. (1998) Plant Cell Environ. 21, 535-553.
    1. Yancey P. H., Clark, M. E., Hand, S. C., Bowlus, R. D. & Somero, G. N. (1982) Science 217, 1214-1222. - PubMed
    1. Crowe J. H., Hoekstra, F. A. & Crowe, L. M. (1992) Annu. Rev. Physiol. 54, 579-599. - PubMed

Publication types

MeSH terms

Substances