. 2002 Dec;107(4):411-9.
doi: 10.1046/j.1365-2567.2002.01519.x.

Induction of immunoglobulin G1, interleukin-6 and interleukin-10 by Taenia crassiceps metacestode carbohydrates

Affiliations

Induction of immunoglobulin G1, interleukin-6 and interleukin-10 by Taenia crassiceps metacestode carbohydrates

Senarath Dissanayake et al. Immunology. 2002 Dec.

Abstract

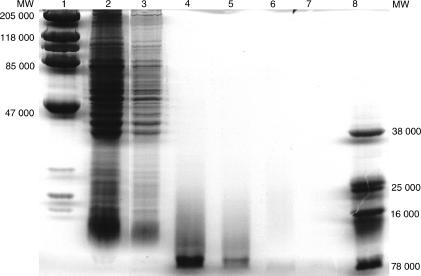
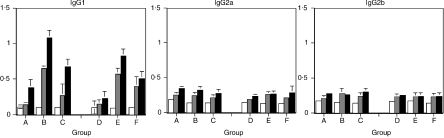
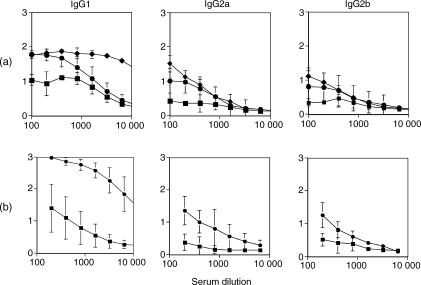
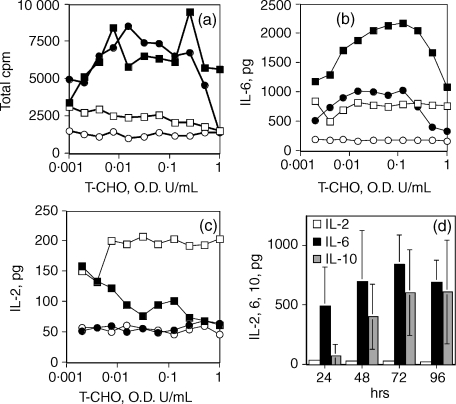
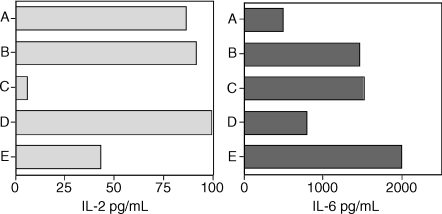
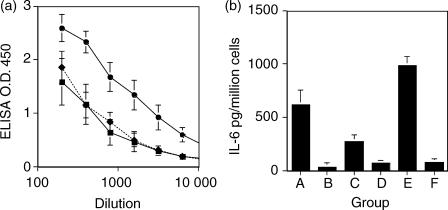
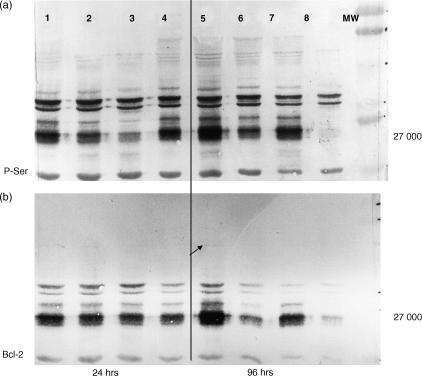
T helper type 2 (Th2) -polarized immune responses are characteristically dominant in helminth infections. Two murine models that show a Th1 to Th2 polarization with infection progression are those of Schistosoma mansoni and Taenia crassiceps. In both, an early Th1 response is replaced by a late Th2 response. We report that the nucleic acid-, protein- and lipid-free carbohydrate fraction of T. crassiceps metacestodes (denoted T-CHO) possesses Th2-like immunomodulatory activity. Immunization of two strains of rats (Dark Agouti and Albino Oxford) and BALB/c mice with chicken albumin in the presence of T-CHO resulted in selective enhancement of immunoglobulin G1 (IgG1) antibodies, considered to be associated with Th2 responses in both rats and mice. Interleukin-6 (IL-6) followed by IL-10 were the dominant cytokines detected in in vitro cultures of mouse spleen cells stimulated with T-CHO. IL-4 and IL-5 were not detected in these culture supernates. Furthermore, Taenia carbohydrates were mitogenic to spleen cells, activated serine phosphorylation of proteins and up-regulated the expression of the anti-apoptotic protein, Bcl-2. When mouse spleen cells were cultured in the presence of Taenia carbohydrates, a concentration-dependent down-regulation of IL-2 and an overlapping up-regulation of IL-6 secretion were seen.


Figures

Figure 1
Figure 1
SDS–PAGE analysis of Taenia carbohydrate extract T-CHO. Lanes 2 and 3, Taenia total extract (lane 3 is a 100-fold dilution of lane 2). Lanes 4 and 5 contain the equivalent of 10- and 100-fold concentrated T-CHO prior to chloroform extraction. Lanes 6 and 7 are the equivalent of lanes 4 and 5, after chloroform extraction. Lanes 1 and 8 are markers.
Figure 2
Figure 2
Histogram showing IgG1, IgG2a and IgG2b antibody levels to chicken albumin in AO (Groups A–C) and DA (Groups D–F) rats immunized with albumin in PBS (Groups A and D), Alum (Groups B and E) and T-CHO (Groups C and F). Bld 1, sera from preimmunization bleed; Bld 2, sera after first boost; and Bld 3, sera at 10 days post second boost. Bld 1-open bars; Bld 2-grey bars; Bld 3-closed bars. There were six animals in each group, sera were tested in duplicate at 1 : 50 dilution. Error bars are SD.
Figure 3
Figure 3
(a) Antibody levels to chicken albumin in BALB/c mice immunized with 50 μg albumin in PBS (▪), Alum (♦) and T-CHO (• 0·5 OD260 U/mouse) as adjuvant. Test sera were collected 10 days after a single booster immunization. (b) Antibody levels to chicken albumin in BALB/c mice immunized with 50 μg albumin in PBS (▪) and T-CHO (• 0·25 OD260 U/mouse) as adjuvant. Sera were collected after two booster immunizations. There were eight animals in both experiments and in each group, sera were tested in duplicate in serial dilutions. Mean + SD of ELISA OD are shown on y axes.
Figure 4
Figure 4
(a) Mitogenic and (b–d) cytokine stimulatory activity of T-CHO. (a–c) Spleen cells from BALB/c mice sensitized with T-CHO (i.p. injection of 0·5 OD260 U) or from naive mice were used. (▪) Spleen cells from T-CHO pre-exposed mice + T-CHO in culture; (□) spleen cells from T-CHO exposed mice + acid-hydrolysed T-CHO in culture; (•) spleen cells from naive mice + T-CHO in culture; (cir;) spleen cells from naive mice + acid hydrolysed T-CHO in culture. Data shown are mean values for pooled spleen cells from two mice, performed in triplicate from two independent experiments. (d) Time–course determination of IL-2, IL-6 and IL-10 secretion by spleen cells from mice exposed to T-CHO, 0·25 OD260 U, 3 days post i.p. injection. Spleen cells from three animals were cultured separately, in triplicate. Error bars are SD. IL-4 and IL-5 were not detected. Representative experiment shown.
Figure 5
Figure 5
Effect of pre-exposure duration to T-CHO and staurosporine in culture on IL-2 (left panel) and of IL-6 (right panel) secretion by spleen cells. Group A, cells from 1-day pre-exposed mice cultured in the absence of T-CHO; group B, same as group A, but cultured in the presence of T-CHO; group C, same as group B, in the presence of staurosporine; group D, cells from 5-day pre-exposed mice cultured in the absence of T-CHO; group E, same as group D but cultured in the presence of T-CHO. Spleen cells from two animals were cultured separately in triplicate. Values shown are the mean for each group. Representative experiment shown.
Figure 6
Figure 6
(a) Effect of T-CHO concentration on the IgG1 response. Mice were immunized with 50 μg albumin in PBS (▪), in T-CHO, 1 OD260 U/mouse (♦) or in T-CHO, 0·25 OD260 U/mouse (•). There were five mice in each group and the mean OD is shown. Error bars are SD. Sera were collected 12 days after the first booster immunization. (b) Effect of extraction procedure on in vitro IL-6 stimulatory effect of T-CHO. Groups A–D, spleen cells from mice presensitized (24 hr) with chloroform-extracted T-CHO were stimulated with PBS and chloroform-extracted T-CHO (group A), water-extracted but not chloroform-extracted T-CHO (group B), water- and chloroform-extracted T-CHO (group C) and no stimulus (group D). Groups E and F, naive cells stimulated in culture with PBS–chloroform-extracted T-CHO (group E) and naive cells with no stimulus in culture (group F). Mean values from two experiments with three mice in each group are shown. Error bars are SD.
Figure 7
Figure 7
Western blot analysis. Serine phosphorylation and Bcl-2 expression in spleen cells cultured in the presence and absence of T-CHO. (a) Serine phosphorylation; (b) Bcl-2 expression after 24 hr in culture and 96 hr in culture. Lanes 1 and 5, spleen cells from pre-exposed mice, cultured in the presence of T-CHO; lanes 2 and 4, cells from T-CHO pre-exposed mice, cultured in the absence T-CHO; lanes 3 and 7, cells from naive mice cultured in the presence of T-CHO and lanes 4 and 8, cells from naive mice cultured in the absence of T-CHO.

References

    1. Urban JF, Finkelman FD, Shea-Donohue T, Gause WC. Cytokine immunomodulation of infectious diseases. In: Kresina TF, editor. Immunomodulatory Agents. New York, Basel, Hong Kong: Marcel Dekker Inc; 1998. pp. 169–86.
    1. Dissanayake S, Zheng HJ, Dreyer G, et al. Evaluation of a recombinant filarial antigen for diagnosis of lymphatic filariasis. Am J Hyg Trop Med. 1994;50:727–34. - PubMed
    1. Hakangard C, Deelder AM, Gabone RM, Nilsson LA, Ouchterlony O. A comparative study on specific antibodies and circulating antigen (CAA) in serum and parasitological findings for diagnosis of Schistosomiasis mansoni in an endemic area in Tanzania. Acta Tropica. 1996;61:213–22. - PubMed
    1. Gryzch JM, Pearce EJ, Cheever A, Caulada P, Caspar S, Hieny S, Lewis F, Sher A. Egg deposition is a major stimulus for the production of Th-2 cytokines in murine Schistosoma mansoni. J Immunol. 1991;146:1322–7. - PubMed
    1. Vella AT, Pearce EJ. CD+ Th-2 response induced by Schistosoma mansoni eggs develops rapidly through an early transient Th0 like stage. J Immunol. 1992;148:2283–90. - PubMed

Publication types

LinkOut - more resources