. 2002 Dec 2;196(11):1427-33.
doi: 10.1084/jem.20021003.

Telomerase activation and rejuvenation of telomere length in stimulated T cells derived from serially transplanted hematopoietic stem cells

Affiliations

Telomerase activation and rejuvenation of telomere length in stimulated T cells derived from serially transplanted hematopoietic stem cells

Richard C Allsopp et al. J Exp Med. .

Abstract

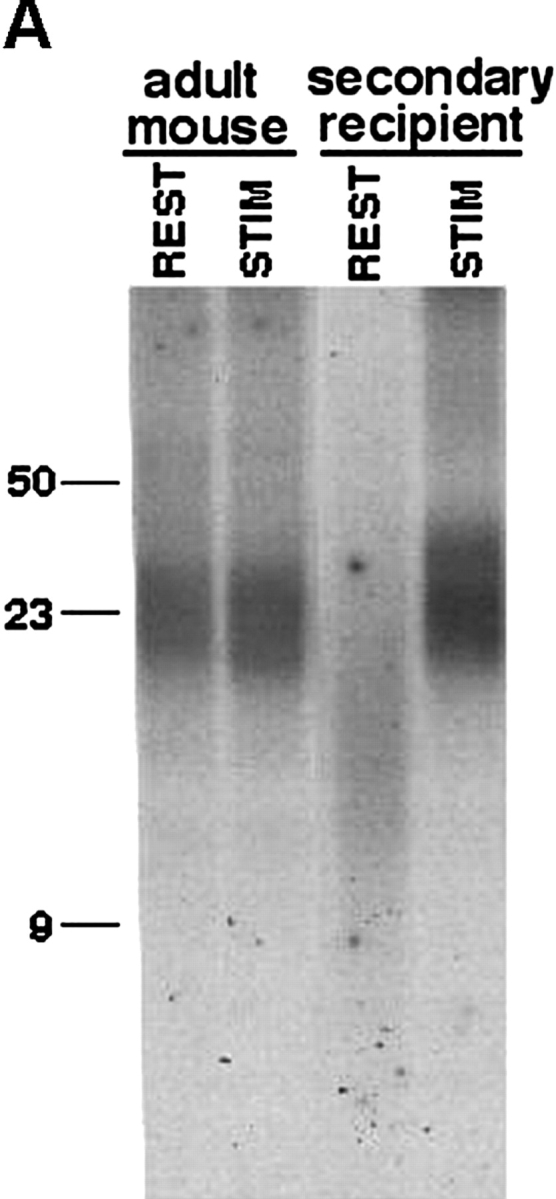
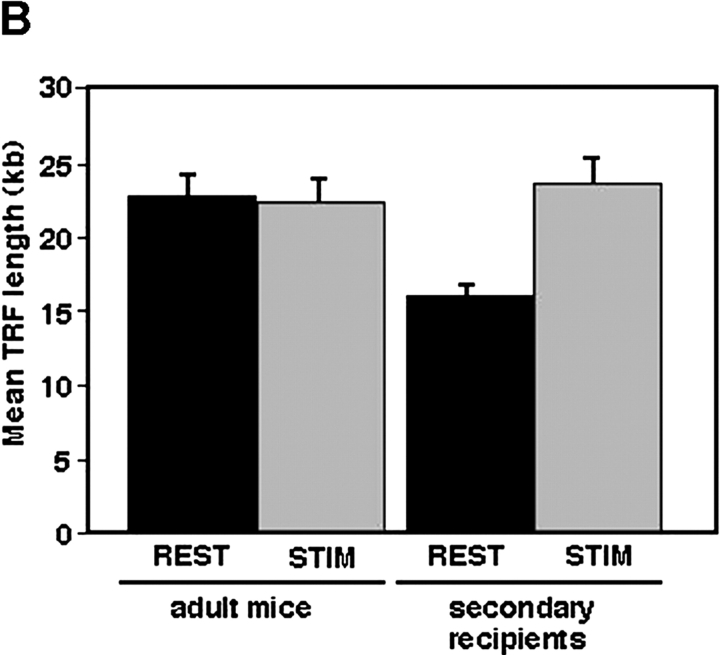
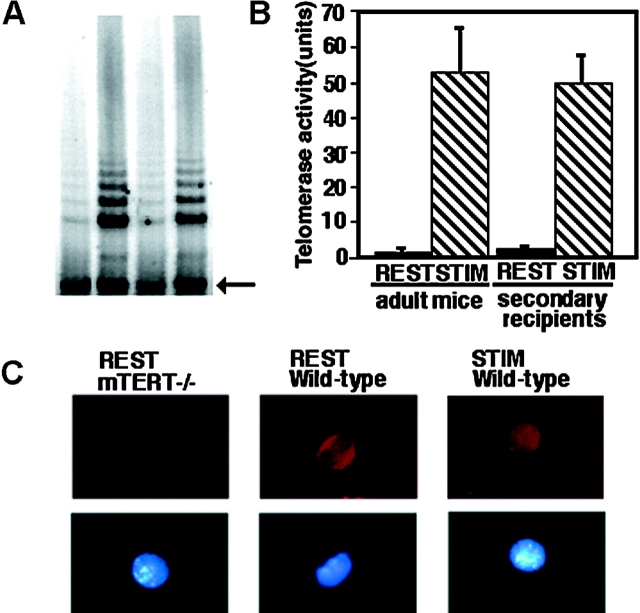
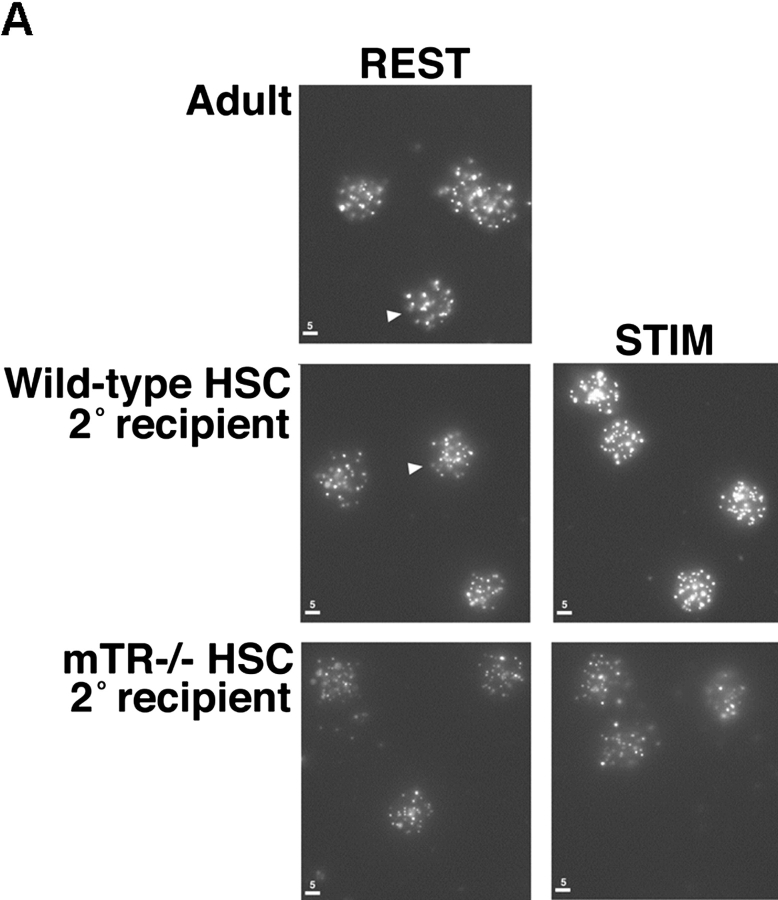
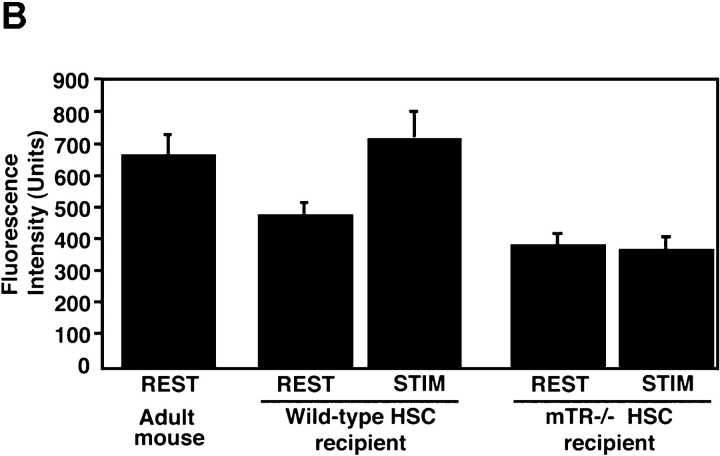
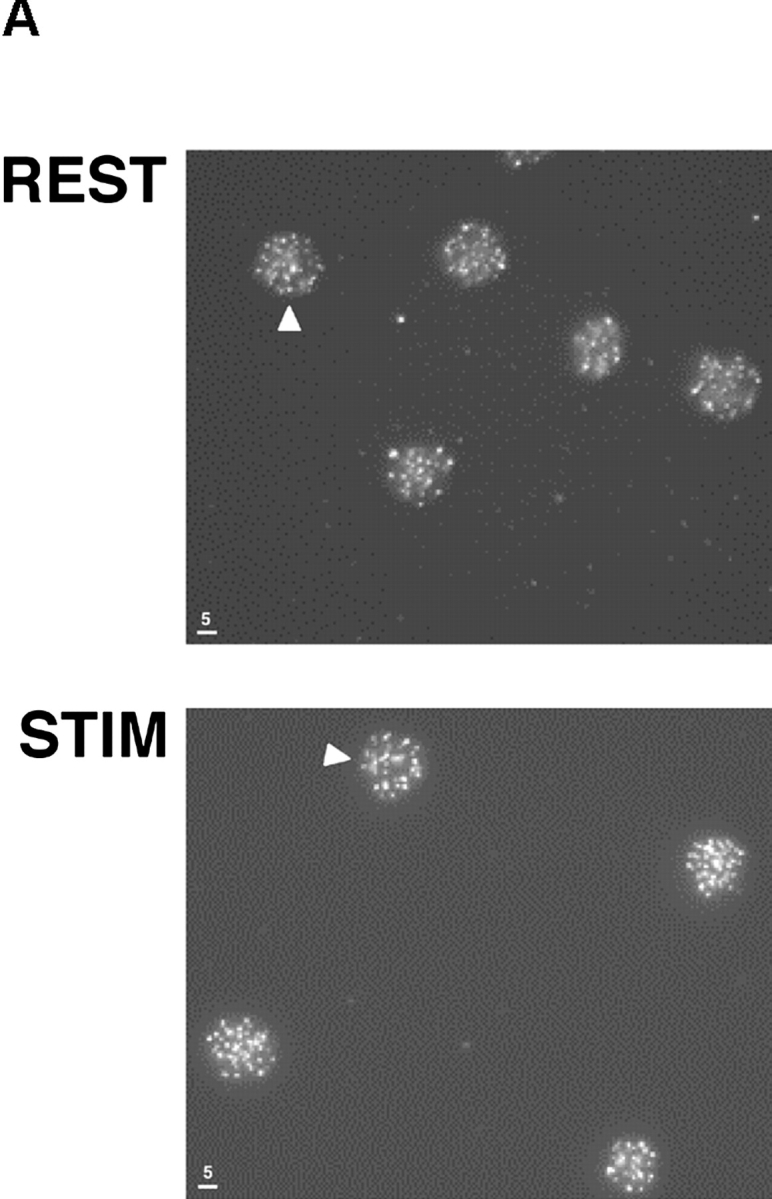
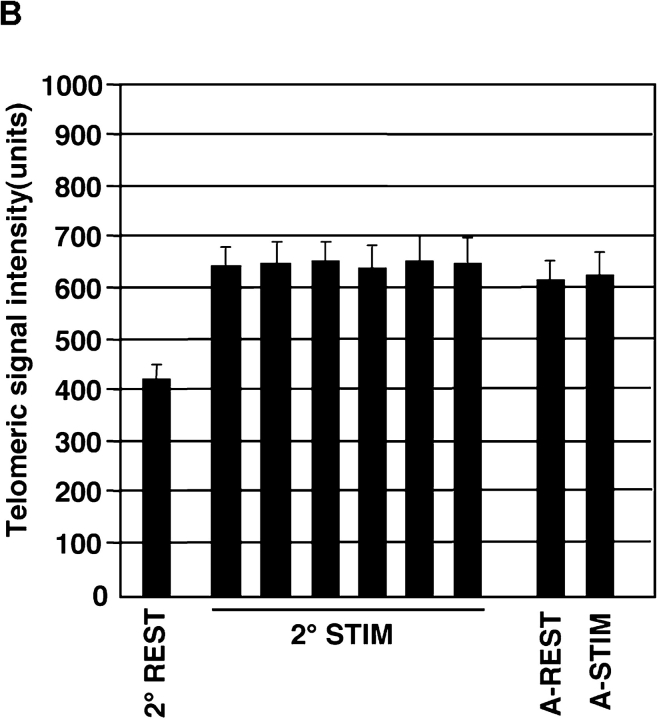
Telomeres shorten in hematopoietic cells, including hematopoietic stem cells (HSCs), during aging and after transplantation, despite the presence of readily detectable levels of telomerase in these cells. In T cells, antigenic stimulation has been shown to result in a marked increase in the level of telomerase activity. We now show that stimulation of T cells derived from serially transplanted HSC results in a telomerase-dependent elongation of telomere length to a size similar to that observed in T cells isolated directly from young mice. Southern analysis of telomere length in resting and anti-CD3/CD28 stimulated donor-derived splenic T cells revealed an increase in telomere size by approximately 7 kb for the population as a whole. Stimulation of donor-derived T cells from recipients of HSCs from telomerase-deficient mice did not result in regeneration of telomere length, demonstrating a dependence on telomerase. Furthermore, clonal anti-CD3/CD28 stimulation of donor-derived T cells followed by fluorescent in situ hybridization (FISH) analysis of telomeric signal intensity showed that telomeres had increased in size by approximately 50% for all clonal expansions. Together, these results imply that one role for telomerase in T cells may be to renew or extend replicative potential via the rejuvenation of telomere length.


Figures

Figure 1.
Figure 1.
Analysis of TRF length of resting and stimulated donor-derived T cells. (A) Splenic T cells (5 × 10⁴) from young adult mice and secondary HSC recipients were collected via FACS® and either transferred to growth media for stimulation or used for isolation of high molecular weight DNA. Anti-CD3/CD28 stimulated T cells were collected for isolation of DNA after 1–2 wk of growth. The extraction and restriction enzyme digestion of DNA was performed as described previously (reference 27). 1 μg of each DNA sample was resolved in a 0.75% agarose gel by field inversion gel electrophoresis (pulse conditions: 180 V forward; 120 V reverse for 16 h). The gel was dried and the DNA hybridized to a 32P-end labeled telomeric oligomer overnight followed by 3 × 5 min washes at 37°C in 0.35× SSC buffer. Images were collected using a Phosphor-Imager screen. Size of molecular weight standards (kilobases) are shown on the left. REST, resting; STIM, anti-CD3/CD28 stimulated. (B) The mean TRF length was calculated and averaged for all resting and stimulated T cell samples taken from a total of five adult mice and seven secondary recipients. Error bars (standard deviation) and P values (Student's t test) are shown.
Figure 1.
Figure 1.
Analysis of TRF length of resting and stimulated donor-derived T cells. (A) Splenic T cells (5 × 10⁴) from young adult mice and secondary HSC recipients were collected via FACS® and either transferred to growth media for stimulation or used for isolation of high molecular weight DNA. Anti-CD3/CD28 stimulated T cells were collected for isolation of DNA after 1–2 wk of growth. The extraction and restriction enzyme digestion of DNA was performed as described previously (reference 27). 1 μg of each DNA sample was resolved in a 0.75% agarose gel by field inversion gel electrophoresis (pulse conditions: 180 V forward; 120 V reverse for 16 h). The gel was dried and the DNA hybridized to a 32P-end labeled telomeric oligomer overnight followed by 3 × 5 min washes at 37°C in 0.35× SSC buffer. Images were collected using a Phosphor-Imager screen. Size of molecular weight standards (kilobases) are shown on the left. REST, resting; STIM, anti-CD3/CD28 stimulated. (B) The mean TRF length was calculated and averaged for all resting and stimulated T cell samples taken from a total of five adult mice and seven secondary recipients. Error bars (standard deviation) and P values (Student's t test) are shown.
Figure 2.
Figure 2.
Analysis of telomerase activity in resting and stimulated donor-derived T cells. (A) Splenic T cells (2 × 10⁵) from young adult mice and secondary HSC recipients were collected via FACS® and either lysed in CHAPS buffer for extraction of telomerase, or transferred to growth media for stimulation. After 2 d of growth, anti-CD3/CD28 stimulated splenic T cells were harvested for extraction of telomerase. Telomerase activity was measured for 500 cell equivalents of each sample extract by the TRAP assay. (B) Telomerase activity was measured for resting (REST) and stimulated (STIM) T cells from a total of five adult mice and seven secondary recipients and averaged for all samples. The mean level of activity and error bars (standard deviation) are shown. (C) Analysis of TERT localization in resting and stimulated T cells. Resting and anti-CD3/CD28 stimulated T cells from mTERT wild-type mice and resting T cells from mTERT knockout mice were fixed and stained with an mTERT antibody (top panel). Corresponding Hoechst 33258 staining for each cell is also shown (bottom panel). Original magnification: ×60.
Figure 3.
Figure 3.
FISH analysis of telomere length in resting and stimulated donor-derived T cells from transplant recipients of HSC from mTR knockout mice. (A) Splenic T cells (5 × 10⁴) from young adult mTR wild-type or knock-out mice and secondary HSC recipients were collected via FACS® and either transferred to growth media for stimulation or fixed. 1 wk after anti-CD3/CD28 stimulation, cells were cytospun onto glass slides and fixed. Telomeres were detected by FISH using a FITC-conjugated peptide nucleic acid telomeric oligomer. Individual interphase nuclei are indicated by arrowheads. Original magnification: ×60. The size scale (μm) is indicated in the bottom left. (B) The fluorescent telomeric signal intensity was calculated and corrected for background for 20 well isolated individual resting or stimulated mTR+/+ or mTR−/− donor-derived splenic T cell nuclei. Telomeric signal intensity was also measured for resting splenic T cells from an adult wild-type mouse. The mean fluorescent signal intensity and standard deviation are shown. Telomeric signal intensity increased significantly (P < 0.005; Student's t test) after stimulation of donor-derived splenic T cells from secondary recipients of mTR+/+ HSCs.
Figure 3.
Figure 3.
FISH analysis of telomere length in resting and stimulated donor-derived T cells from transplant recipients of HSC from mTR knockout mice. (A) Splenic T cells (5 × 10⁴) from young adult mTR wild-type or knock-out mice and secondary HSC recipients were collected via FACS® and either transferred to growth media for stimulation or fixed. 1 wk after anti-CD3/CD28 stimulation, cells were cytospun onto glass slides and fixed. Telomeres were detected by FISH using a FITC-conjugated peptide nucleic acid telomeric oligomer. Individual interphase nuclei are indicated by arrowheads. Original magnification: ×60. The size scale (μm) is indicated in the bottom left. (B) The fluorescent telomeric signal intensity was calculated and corrected for background for 20 well isolated individual resting or stimulated mTR+/+ or mTR−/− donor-derived splenic T cell nuclei. Telomeric signal intensity was also measured for resting splenic T cells from an adult wild-type mouse. The mean fluorescent signal intensity and standard deviation are shown. Telomeric signal intensity increased significantly (P < 0.005; Student's t test) after stimulation of donor-derived splenic T cells from secondary recipients of mTR+/+ HSCs.
Figure 4.
Figure 4.
FISH analysis of telomere length after clonal stimulation of donor-derived T cells. (A) Splenic T cells were sorted into 10 pools of 10 cells, 9 cells from a H2K-GFP transgenic mouse, and 1 cell of donor type from a secondary HSC recipient, in growth media in a 96-well V-bottomed dish for stimulation. Resting splenic T cells were also collected via FACS, cyto-spun onto slides, and fixed at this time. 17 d after stimulation, T cells derived from the secondary recipient (i.e., non-GFP cells) were collected via FACS® from each stimulated pool in which they could be detected, and either cyto-spun onto glass slides, and fixed or used for confirmation of T cell functionality by TCR clonotype analysis (reference ; unpublished data). The telomeres were detected by FISH using a FITC-conjugated peptide nucleic acid telomeric oligomer. Individual interphase nuclei are indicated by arrowheads. Sample images of stained nuclei collected from resting splenic T cells (top panel) and of one clonal pool of anti-CD3/CD28 stimulated splenic T cells from a secondary recipient (bottom panel) are shown. Original magnification: ×60. The size scale (μm) is indicated in the bottom left. (B) The fluorescent telomeric signal intensity was calculated and corrected for background for 20 well isolated individual resting or stimulated splenic T cell nuclei from a secondary recipient. Telomeric signal intensity was also measured for resting and clonally stimulated splenic T cells (n = 20 for each) from a C57Bl6/Ka Thy1.1 mouse. The mean fluorescent signal intensity and standard deviation are shown. For all clonal expansions derived from T cells from the secondary HSC recipient, the telomere signal intensity increased significantly relative to resting T cells from the same mouse (P ≤ 0.005; Student's t test).
Figure 4.
Figure 4.
FISH analysis of telomere length after clonal stimulation of donor-derived T cells. (A) Splenic T cells were sorted into 10 pools of 10 cells, 9 cells from a H2K-GFP transgenic mouse, and 1 cell of donor type from a secondary HSC recipient, in growth media in a 96-well V-bottomed dish for stimulation. Resting splenic T cells were also collected via FACS, cyto-spun onto slides, and fixed at this time. 17 d after stimulation, T cells derived from the secondary recipient (i.e., non-GFP cells) were collected via FACS® from each stimulated pool in which they could be detected, and either cyto-spun onto glass slides, and fixed or used for confirmation of T cell functionality by TCR clonotype analysis (reference ; unpublished data). The telomeres were detected by FISH using a FITC-conjugated peptide nucleic acid telomeric oligomer. Individual interphase nuclei are indicated by arrowheads. Sample images of stained nuclei collected from resting splenic T cells (top panel) and of one clonal pool of anti-CD3/CD28 stimulated splenic T cells from a secondary recipient (bottom panel) are shown. Original magnification: ×60. The size scale (μm) is indicated in the bottom left. (B) The fluorescent telomeric signal intensity was calculated and corrected for background for 20 well isolated individual resting or stimulated splenic T cell nuclei from a secondary recipient. Telomeric signal intensity was also measured for resting and clonally stimulated splenic T cells (n = 20 for each) from a C57Bl6/Ka Thy1.1 mouse. The mean fluorescent signal intensity and standard deviation are shown. For all clonal expansions derived from T cells from the secondary HSC recipient, the telomere signal intensity increased significantly relative to resting T cells from the same mouse (P ≤ 0.005; Student's t test).

References

    1. McClintock, B. 1941. The stability of broken ends of chromosomes in Zea mays. Genetics. 26:234–282. - PMC - PubMed
    1. Counter, C.M., A.A. Avilion, C.E. LeFeuvre, N.G. Stewart, C.W. Greider, C.B. Harley, and S.B. Bacchetti. 1992. Telomere shortening associated with chromosomal instability is arrested in immortal cells which express telomerase activity. EMBO J. 11:1921–1929. - PMC - PubMed
    1. Blasco, M., H.W. Lee, M.P. Hande, E. Samper, P.M. Lansdorp, R.A. DePinho, and C.W. Greider. 1996. Telomere shortening and tumor formation by mouse cells lacking telomerase RNA. Cell. 91:25–34. - PubMed
    1. Meyne, J., R.L. Ratliff, and R.K. Moyzis. 1989. Conservation of the human telomere sequence (TTAGGG)n among vertebrates. Proc. Natl. Acad. Sci. USA. 86:7049–7053. - PMC - PubMed
    1. Klobutcher, L.A., M.T. Swanton, P. Donini, and D.M. Prescott. 1981. All gene-sized DNA molecules in 4 species of hypotrichs have the same terminal sequence and an unusual 3′ terminus. Proc. Natl. Acad. Sci. USA. 78:3015–3018. - PMC - PubMed

Publication types