. 2002 Dec 2;196(11):1435-46.
doi: 10.1084/jem.20020493.

Complex carbohydrates are not removed during processing of glycoproteins by dendritic cells: processing of tumor antigen MUC1 glycopeptides for presentation to major histocompatibility complex class II-restricted T cells

Affiliations

Complex carbohydrates are not removed during processing of glycoproteins by dendritic cells: processing of tumor antigen MUC1 glycopeptides for presentation to major histocompatibility complex class II-restricted T cells

Anda M Vlad et al. J Exp Med. .

Abstract

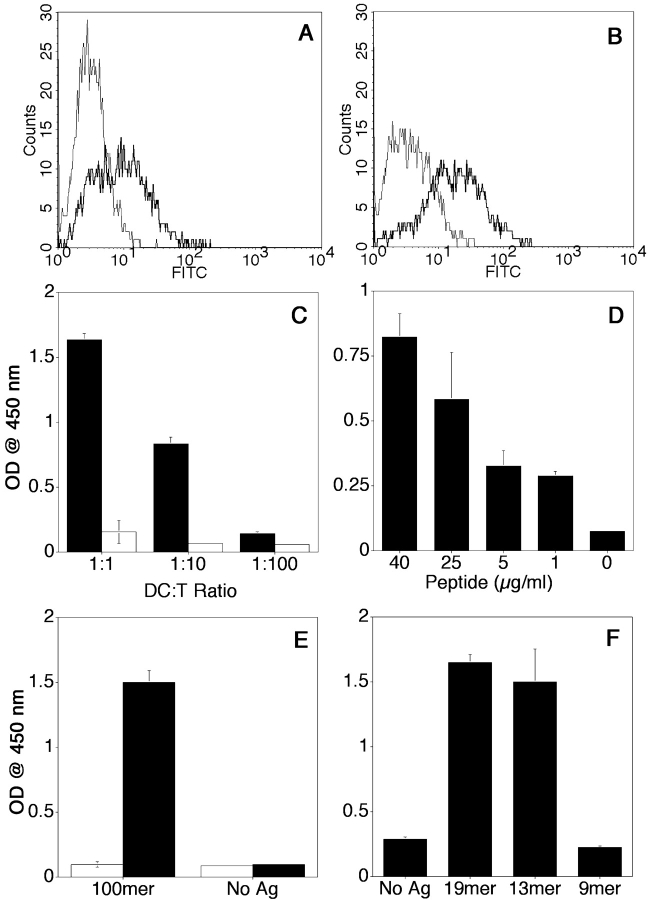
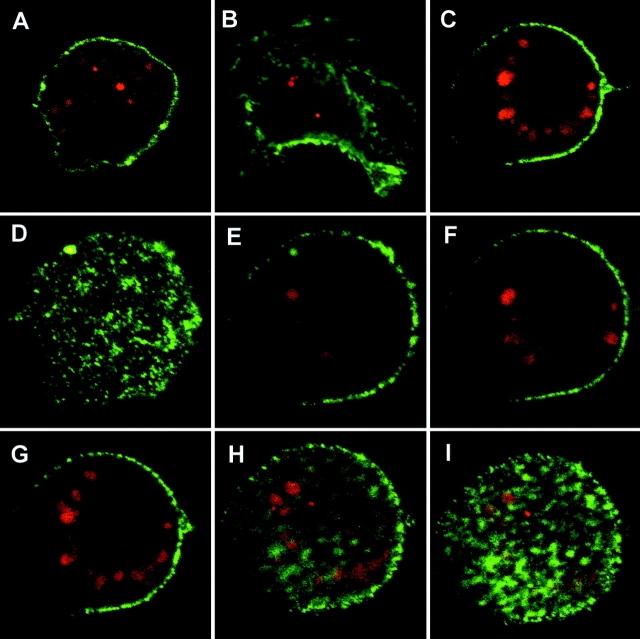
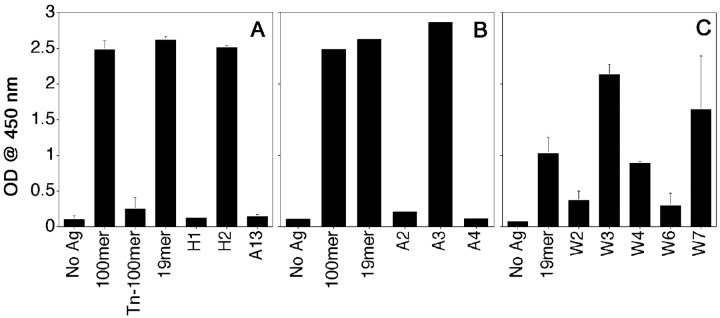
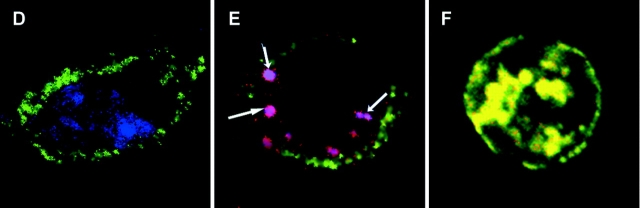
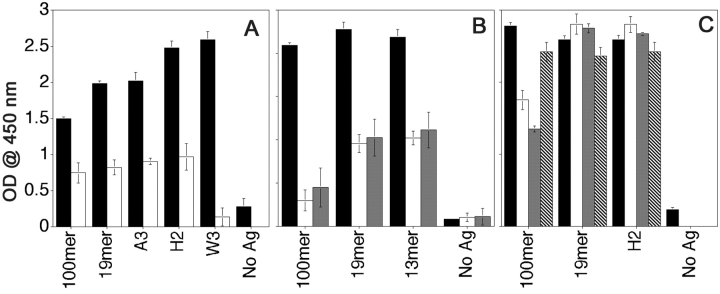
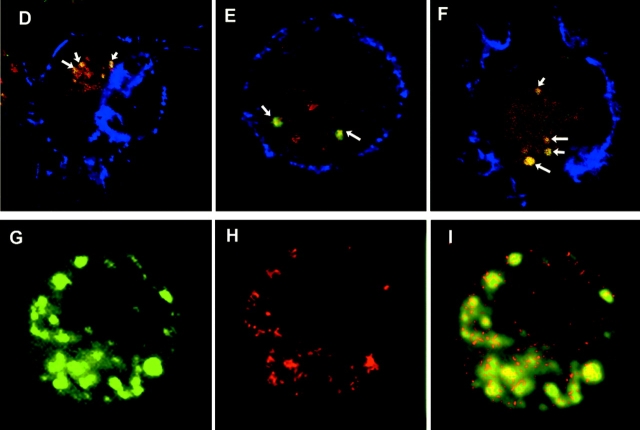
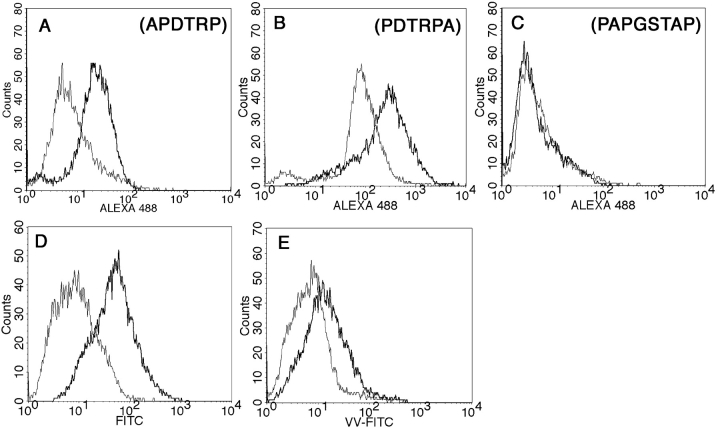
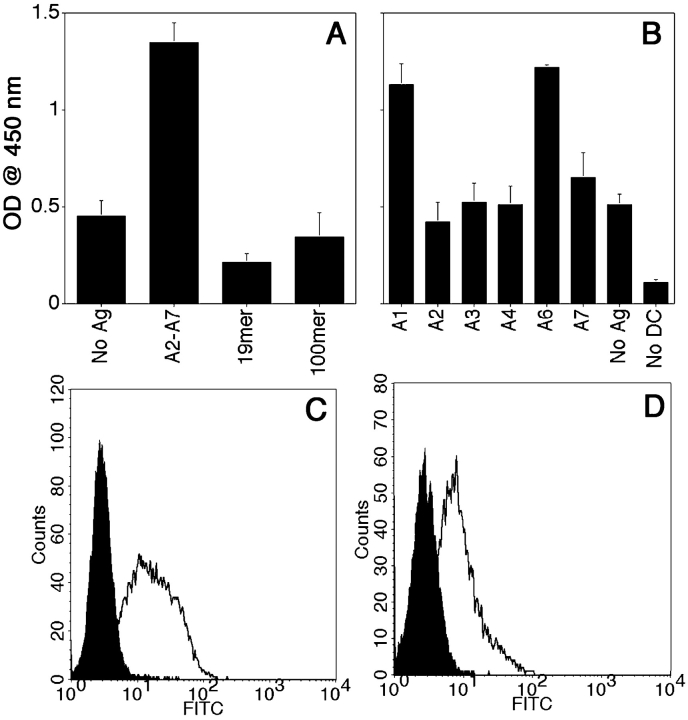
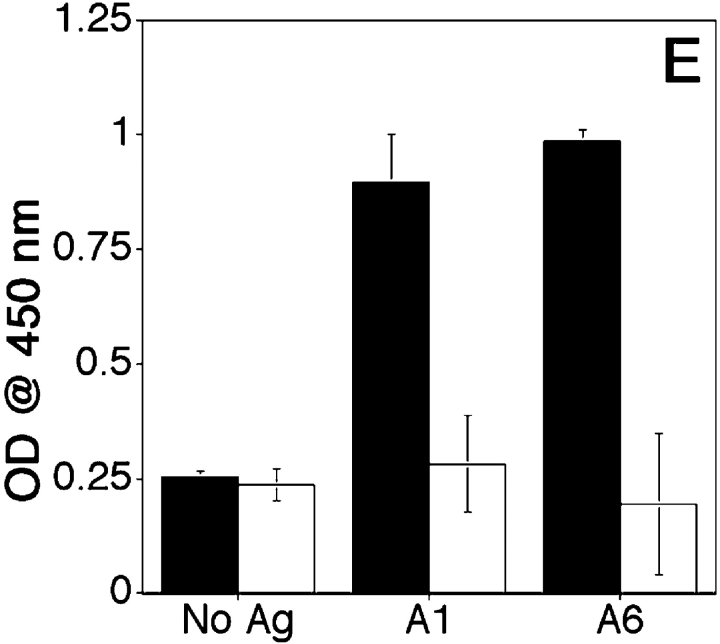
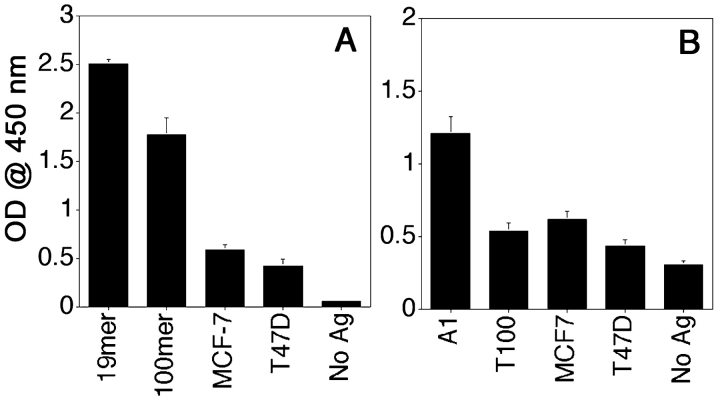
In contrast to protein antigens, processing of glycoproteins by dendritic cells (DCs) for presentation to T cells has not been well studied. We developed mouse T cell hybridomas to study processing and presentation of the tumor antigen MUC1 as a model glycoprotein. MUC1 is expressed on the surface as well as secreted by human adenocarcinomas. Circulating soluble MUC1 is available for uptake, processing, and presentation by DCs in vivo and better understanding of how that process functions in the case of glycosylated antigens may shed light on antitumor immune responses that could be initiated against this glycoprotein. We show that DCs endocytose MUC1 glycopeptides, transport them to acidic compartments, process them into smaller peptides, and present them on major histocompatability complex (MHC) class II molecules without removing the carbohydrates. Glycopeptides that are presented on DCs are recognized by T cells. This suggests that a much broader repertoire of T cells could be elicited against MUC1 and other glycoproteins than expected based only on their peptide sequences.


Figures

Figure 1.
Figure 1.
Phenotypic and functional characterization of MUC1 peptide-specific T hybridoma VF5. Flow cytometric analysis was performed for CD3 (A) and CD4 (B) expression. Cells were incubated in the presence of either FITC-labeled isotype control antibody (thin line) or anti-CD3 or anti–CD4-FITC (thick line) antibodies. Antigen specificity was assessed in IL-2 detection assay, by ELISA (C and D). Day 5 bone marrow–derived DCs were loaded with 40 μg/ml 100mer MUC1 peptide and coincubated with VF5 T cells at various DC/T cell ratios (x axis), in triplicate, for 24 h (C). DCs were loaded for 16 h with various concentrations of 100mer peptide (in μg/ml, on the x axis) and added to VF5 T cells at a 1:10 ratio (D). VF5 cells were coincubated (1:10 DC/T cell ratio) with either syngenic DCs from C57Bl/6 (I-Ab) mice or with allogeneic DCs from B6.NOD mice (I-Ag7) mice, pulsed with 20 μg/ml antigen as described above (E). DCs were loaded with 20 μg/ml of 100mer, 19mer, 13mer, and 9mer MUC1 peptides, in triplicates, for 16 h and then added to VF5 cells at a 1:10 ratio (F). After 24 h of coculture, the supernatant was tested for IL-2 by ELISA (C–F). Results represent means of optical density units. Every assay had an IL-2 standard curve included. IL-2 production by T cells in the presence of antigen-loaded DCs was compared with IL-2 production in the presence of control DCs and statistical significance determined using Student's t test (P < 0.005).
Figure 2.
Figure 2.
Intracellular localization of MUC1 synthetic peptides after endocytosis by DCs. DCs were exogenously loaded with Cy 3 (red)-labeled 100mer (A), 19mer (B), and 13mer (C) peptides for 2 h, washed, fixed, and counterstained green for cell surface IAb and analyzed with confocal laser microscopy. Panel C represents one section from a series of 16 0.5-μm thick sections taken through a cell pulsed with 13mer peptide, six of which are shown in panels D-I. All images were acquired at ×100 original magnification.
Figure 3.
Figure 3.
Selective recognition by peptide-specific clone VF5 of DC loaded with different glycopeptides. DCs were loaded with indicated MUC1 peptides and glycopeptides at 20 μg/ml for 16 h, then coincubated with VF5 cells at 1:10 ratio, for 24 h. Culture supernatants were assayed for IL-2 presence by ELISA as described above. (A) DCs were loaded with 100mer and 21mer peptides modified with tumor-like monosaccharide Tn (GalNAc) antigen. (B) DCs were loaded with peptides modified with tumor-like disaccharide T (Gal-GalNAc) antigen. (C) DCs were loaded with trisaccharide glycopeptides (W2, W3, and W4) or heptasaccharide glycopeptides (W6 and W7). Precise sites of glycosylation of all glycopeptides can be found in Table I. Results are represented as means of optical density units. (D and E) Confocal micrographs of DCs (stained green for cell surface MHC class II) exogenously pulsed with Cy5-labeled (blue) Tn100mer antigen alone (D) or together with Cy3–100mer (red) MUC1 peptide (E) for 2 h. Colocalization of peptide and glycopeptide in vesicular compartments (purple) marked with arrows. (F) Colocalization (in yellow) of Tn-100mer peptide (red) with I-Ab (green) in DCs stained, after 2-h antigen pulse, for cell surface and intracellular MHC class II. Images are single scanned sections acquired at original magnification: ×100.
Figure 3.
Figure 3.
Selective recognition by peptide-specific clone VF5 of DC loaded with different glycopeptides. DCs were loaded with indicated MUC1 peptides and glycopeptides at 20 μg/ml for 16 h, then coincubated with VF5 cells at 1:10 ratio, for 24 h. Culture supernatants were assayed for IL-2 presence by ELISA as described above. (A) DCs were loaded with 100mer and 21mer peptides modified with tumor-like monosaccharide Tn (GalNAc) antigen. (B) DCs were loaded with peptides modified with tumor-like disaccharide T (Gal-GalNAc) antigen. (C) DCs were loaded with trisaccharide glycopeptides (W2, W3, and W4) or heptasaccharide glycopeptides (W6 and W7). Precise sites of glycosylation of all glycopeptides can be found in Table I. Results are represented as means of optical density units. (D and E) Confocal micrographs of DCs (stained green for cell surface MHC class II) exogenously pulsed with Cy5-labeled (blue) Tn100mer antigen alone (D) or together with Cy3–100mer (red) MUC1 peptide (E) for 2 h. Colocalization of peptide and glycopeptide in vesicular compartments (purple) marked with arrows. (F) Colocalization (in yellow) of Tn-100mer peptide (red) with I-Ab (green) in DCs stained, after 2-h antigen pulse, for cell surface and intracellular MHC class II. Images are single scanned sections acquired at original magnification: ×100.
Figure 4.
Figure 4.
Inhibition of uptake and processing in endocytic compartments of both long and short MUC1 peptides and glycopeptides. DCs were either briefly fixed in 1% PFA (A, white bars), pretreated with 2 mM sodium azide/100 μM 2 deoxyglucose (B, white bars) or with a protease inhibitors cocktail (C) 100-fold (white bars) or 25-fold diluted (gray bars), 30 min before addition of 20 μg/ml MUC1 peptides and glycopeptides. No inhibitor was added to control DCs (black bars in A–C). In panel B, DCs were pulsed with antigen on ice (gray bars). In panel C, hatched bars represent DMSO control treated DCs. After 6 h of pulse, treated and untreated DCs were incubated with the VF5 cells and IL-2 was measured by ELISA. (D–F) Confocal micrographs of DCs exogenously pulsed with Cy3-labeled (red) 100mer (D), 19mer (E), and 13mer (F) MUC1 peptides for 2 h. During the last 30 min of the pulse period, DCs were also fed BODIPY FL Pepstatin A (green). Surface staining for MHC class II is shown in blue. Overlay sections show area of red-green colocalization (yellow) marked with arrows. (G–I). Confocal micrograph of DCs pulsed with Cy5-labeled 19mer peptide for 2 h and stained after the pulse for extracellular and intracellular I-Ab (green, G). Colocalization of antigen (red, H) and MHC class II in yellow (I).
Figure 4.
Figure 4.
Inhibition of uptake and processing in endocytic compartments of both long and short MUC1 peptides and glycopeptides. DCs were either briefly fixed in 1% PFA (A, white bars), pretreated with 2 mM sodium azide/100 μM 2 deoxyglucose (B, white bars) or with a protease inhibitors cocktail (C) 100-fold (white bars) or 25-fold diluted (gray bars), 30 min before addition of 20 μg/ml MUC1 peptides and glycopeptides. No inhibitor was added to control DCs (black bars in A–C). In panel B, DCs were pulsed with antigen on ice (gray bars). In panel C, hatched bars represent DMSO control treated DCs. After 6 h of pulse, treated and untreated DCs were incubated with the VF5 cells and IL-2 was measured by ELISA. (D–F) Confocal micrographs of DCs exogenously pulsed with Cy3-labeled (red) 100mer (D), 19mer (E), and 13mer (F) MUC1 peptides for 2 h. During the last 30 min of the pulse period, DCs were also fed BODIPY FL Pepstatin A (green). Surface staining for MHC class II is shown in blue. Overlay sections show area of red-green colocalization (yellow) marked with arrows. (G–I). Confocal micrograph of DCs pulsed with Cy5-labeled 19mer peptide for 2 h and stained after the pulse for extracellular and intracellular I-Ab (green, G). Colocalization of antigen (red, H) and MHC class II in yellow (I).
Figure 5.
Figure 5.
Detection of processed MUC1 glycoepitopes on DC surface by antibody and lectin staining. DCs were pulsed for 16 h with 20 μg/ml Tn-100mer MUC1 peptide and stained with anti-MUC1 antibodies VU-4-H5 (A), VU-3-C6 (B) and BCP9 (C). Epitopes recognized by each antibody are shown. Goat anti–mouse ALEXA 488 was used as a fluorescent secondary antibody. (D and E) Staining with FITC-labeled Vicia villosa lectin highly specific for Tn antigen. Thin line histograms represent staining of control DCs, thick line represents staining of Tn-100mer-loaded DCs (D). DCs were loaded with Tn-100mer either prior (thick line) or after (thin line) fixation in 1% PFA for 10 min at room temperature (E).
Figure 6.
Figure 6.
Characterization of VF9, a glycopeptide-specific T hybridoma. DCs were loaded for 16 h with either pooled A2-A7 glycopeptides (20 μg/ml each) (A), or individual glycopeptides (B). DCs were then coincubated with VF9 cells for 24 h and supernatants tested for IL-2 presence by ELISA, as described above. (C and D) Flow cytometric analysis was performed for CD3 (C) and CD4 (D) expression. Cells were incubated in the presence of either FITC-labeled isotype control antibody (filled histograms) or anti-CD3 or anti-CD4-FITC antibodies. (E) VF9 cells were coincubated (1:10 DC/T cell ratio) with either syngeneic DCs from C57Bl/6 (I-Ab) mice or with allogeneic DCs from B6.NOD mice (I-Ag7) mice, pulsed with 20 μg/ml antigen, and IL-2 presence assayed by ELISA, as described above.
Figure 6.
Figure 6.
Characterization of VF9, a glycopeptide-specific T hybridoma. DCs were loaded for 16 h with either pooled A2-A7 glycopeptides (20 μg/ml each) (A), or individual glycopeptides (B). DCs were then coincubated with VF9 cells for 24 h and supernatants tested for IL-2 presence by ELISA, as described above. (C and D) Flow cytometric analysis was performed for CD3 (C) and CD4 (D) expression. Cells were incubated in the presence of either FITC-labeled isotype control antibody (filled histograms) or anti-CD3 or anti-CD4-FITC antibodies. (E) VF9 cells were coincubated (1:10 DC/T cell ratio) with either syngeneic DCs from C57Bl/6 (I-Ab) mice or with allogeneic DCs from B6.NOD mice (I-Ag7) mice, pulsed with 20 μg/ml antigen, and IL-2 presence assayed by ELISA, as described above.
Figure 7.
Figure 7.
VF5 and VF9 responses to tumor MUC1 glycoforms. DCs were loaded for 16 h with antigen and coincubated with peptide-specific VF5 (A) or VF9 hybridomas (B) for 24 h and supernatants tested for IL-2 presence by ELISA, as described above.

Similar articles

Cited by

References

    1. Lehner, P.J., and P. Cresswell. 1996. Processing and delivery of peptides presented by MHC class I molecules. Curr. Opin. Immunol. 8:59–67. - PubMed
    1. Germain, R.N., F. Castellino, R. Han, C. Reis e Sousa, P. Romagnoli, S. Sadegh-Nasseri, and G.M. Zhong. 1996. Processing and presentation of endocytically acquired protein antigens by MHC class II and class I molecules. Immunol. Rev. 151:5–30. - PubMed
    1. Pieters, J. 2000. MHC class II-restricted antigen processing and presentation. Adv. Immunol. 75:159–208. - PubMed
    1. Watts, C. 2001. Antigen processing in the endocytic compartment. Curr. Opin. Immunol. 13:26–31. - PubMed
    1. Harding, C.V. 1996. Class II antigen processing: analysis of compartments and functions. Crit. Rev. Immunol. 16:13–29. - PubMed

Publication types