. 2002 Dec 24;99(26):17101-6.
doi: 10.1073/pnas.262663699. Epub 2002 Dec 2.

Longitudinal pattern of basilar membrane vibration in the sensitive cochlea

Affiliations

Longitudinal pattern of basilar membrane vibration in the sensitive cochlea

Tianying Ren. Proc Natl Acad Sci U S A. .

Abstract

In the normal mammalian ear, sound vibrates the eardrum, causing the tiny bones of the middle ear to vibrate, transferring the vibration to the inner ear fluids. The vibration propagates from the base of the cochlea to its apex along the cochlear partition. As essential as this concept is to the theory of hearing, the waveform of cochlear partition vibration has yet to be measured in vivo. Here I report a "snapshot" (the instantaneous waveform of cochlear partition vibration) measured in the basal turn of the sensitive gerbil cochlea using a scanning laser interferometer. For 16-kHz tones, the phase delay is up to 6pi radians over the observed cochlear length (<1,000 microm), and instantaneous waveforms show sound propagation along the cochlear partition, supporting the existence of the cochlear traveling wave. The detectable basilar membrane response to a low-level 16-kHz tone occurs over a very restricted ( approximately equal 600 microm) range. The observed vibration shows compressive nonlinear growth, a shorter wavelength, and a slower propagation velocity along the cochlear length than previously reported. Data obtained at different frequencies show the relationship between the longitudinal pattern and frequency tuning, demonstrating that the observed localized traveling wave in this study is indeed the spatial representation of the sharp tuning observed in the frequency domain.


Figures
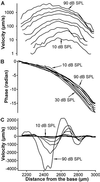
Fig 1.
Fig 1.
Transverse velocity magnitude, phase, and instantaneous waveform of BM vibration. Intensity of stimuli is expressed as dB SPL, defined as dB with respect to 20 μPa. The phase is referenced to BM vibration at the basal end of the measured region at 90 dB SPL. (A) Magnitude responses to a 16-kHz tone at different intensities are plotted as a function of the longitudinal location. Data show nonlinear compressive growth near and above the CF place, the peak shift toward the base with intensity increase, and the restricted distribution of detectable vibration along the BM at low sound pressure levels. (B) Phase curves indicate that, as the wave travels through the range near the CF site, the wavelength becomes shorter and the propagation speed decreases. Phase lag over the observed longitudinal region (<1,000 μm) is as great as ≈6π radians. (C) Instantaneous waveforms of BM vibration at different intensities.
Fig 2.
Fig 2.
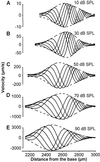
Time sequences of BM vibrations with sequential (1/4)π radians phase intervals at different intensities (10–90 dB SPL). The vibration envelope (dashed lines) for each sound pressure level was obtained by using a cubic spline function based on the data in Fig. 1A. Solid lines are instantaneous waveforms. Vibration peaks shift toward the base, and the longitudinally compressed waveforms spread out with sound pressure increase.
Fig 3.
Fig 3.
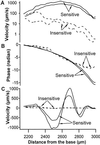
Longitudinal patterns of the magnitude and phase of the transverse velocity of BM responses in sensitive and insensitive cochleae. Insensitive data were collected by using 16-kHz tones at 60 and 70 dB SPL ≈10 min postmortem, and sensitive data are from Fig. 1A. Near the 16-kHz CF location (≈2,550 μm), the velocity in the insensitive cochlea is >30 dB less than in the sensitive cochlea. The overall peak in the sensitive cochlea (solid lines) disappeared in the insensitive cochlea (dashed lines). The wider separation between the two dashed lines than between the solid lines indicates linear growth in the postmortem cochlea. (B) The flatter overall phase slope and the much smaller phase lag of the dashed lines than the solid lines represent a longer wavelength and a faster propagation velocity in the insensitive cochlea. (C) The instantaneous waveforms.
Fig 4.
Fig 4.
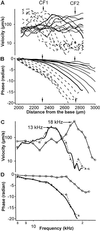
The relationship between the longitudinal pattern and the frequency tuning of BM vibration. (A) The longitudinal patterns of BM responses to tones at different frequencies from 8 to 24 KHz in 1-kHz steps and at a constant intensity of 60 dB SPL. The thick solid line is 16 kHz, dashed lines are frequencies >16 kHz, and thin solid lines are frequencies <16 kHz. (B) Phase curves. (C and D) Magnitude and phase transfer functions. Magnitude transfer function based on data at ≈2,750 μm (dashed line) shows a response peak at ≈13 kHz, and magnitude transfer function based on data at ≈2,300 μm (thin solid line) shows a peak at ≈18 kHz. Thick solid lines in C and D are the magnitude and phase transfer functions measured in another sensitive cochlea at 60 dB SPL, which closely match dashed lines.

References

    1. Zwislocki J. J., (2002) Auditory Sound Transmission: An Autobiographical Perspective (Lawrence Erlbaum, Mahwah, NJ).
    1. von Békésy G., (1960) Experiments in Hearing (McGraw–Hill, New York).
    1. Khanna S. M. & Leonard, D. G. (1982) Science 215, 305-306. - PubMed
    1. Rhode W. S. (1971) J. Acoust. Soc. Am. 49, 1218-1231. - PubMed
    1. Sellick P. M., Patuzzi, R. & Johnstone, B. M. (1982) J. Acoust. Soc. Am. 72, 131-141. - PubMed

Publication types