The directional atomic solvation energy: an atom-based potential for the assignment of protein sequences to known folds
- PMID: 12461172
- PMCID: PMC138561
- DOI: 10.1073/pnas.252626399
The directional atomic solvation energy: an atom-based potential for the assignment of protein sequences to known folds
Abstract
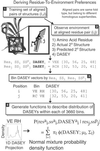
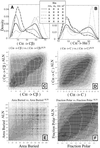
The Directional Atomic Solvation EnergY (DASEY) is an atom-based description of the environment of an amino acid position within a known 3D protein structure. The DASEY has been developed to align and score a probe amino acid sequence to a library of template protein structures for fold assignment. DASEY is computed by summing the atomic solvation parameters of atoms falling within a tetrahedral sector, or petal, extending 16 A along each of the four bond axes of each alpha-carbon atom of the protein. The DASEY discriminates between pairs of structurally equivalent positions and random pairs in protein structures sharing a fold but belonging to different superfamilies, unlike some previous descriptors of protein environments, such as buried area. Furthermore, the DASEY values have characteristic patterns of residue replacement, an essential feature of a successful fold assignment method. Benchmarking fold assignment with DASEY achieves coverage of 56% of sequences with 90% accuracy when probe sequences are matched to protein structural templates belonging to the same fold but to a different superfamily, an improvement of greater than 200% over a previous method.
Figures


Similar articles
-
A 3D-1D substitution matrix for protein fold recognition that includes predicted secondary structure of the sequence.J Mol Biol. 1997 Apr 11;267(4):1026-38. doi: 10.1006/jmbi.1997.0924. J Mol Biol. 1997. PMID: 9135128
-
The 1.7 A crystal structure of BPI: a study of how two dissimilar amino acid sequences can adopt the same fold.J Mol Biol. 2000 Jun 16;299(4):1019-34. doi: 10.1006/jmbi.2000.3805. J Mol Biol. 2000. PMID: 10843855
-
DPANN: improved sequence to structure alignments following fold recognition.Proteins. 2004 Aug 15;56(3):528-38. doi: 10.1002/prot.20144. Proteins. 2004. PMID: 15229885
-
Assigning amino acid sequences to 3-dimensional protein folds.FASEB J. 1996 Jan;10(1):126-36. doi: 10.1096/fasebj.10.1.8566533. FASEB J. 1996. PMID: 8566533 Review.
-
Are knowledge-based potentials derived from protein structure sets discriminative with respect to amino acid types?Proteins. 1998 May 15;31(3):225-46. Proteins. 1998. PMID: 9593195 Review.
Cited by
-
Toc12, a novel subunit of the intermembrane space preprotein translocon of chloroplasts.Mol Biol Cell. 2004 Nov;15(11):5130-44. doi: 10.1091/mbc.e04-05-0405. Epub 2004 Aug 18. Mol Biol Cell. 2004. PMID: 15317846 Free PMC article.
-
EvDTree: structure-dependent substitution profiles based on decision tree classification of 3D environments.BMC Bioinformatics. 2005 Jan 10;6:4. doi: 10.1186/1471-2105-6-4. BMC Bioinformatics. 2005. PMID: 15638949 Free PMC article.
-
A mutation in the vesicle-trafficking protein VAPB causes late-onset spinal muscular atrophy and amyotrophic lateral sclerosis.Am J Hum Genet. 2004 Nov;75(5):822-31. doi: 10.1086/425287. Epub 2004 Sep 15. Am J Hum Genet. 2004. PMID: 15372378 Free PMC article.
-
Protein-solvent interactions.Chem Rev. 2006 May;106(5):1616-23. doi: 10.1021/cr040437f. Chem Rev. 2006. PMID: 16683747 Free PMC article. Review. No abstract available.
-
Analysis of the "thermodynamic information content" of a Homo sapiens structural database reveals hierarchical thermodynamic organization.Protein Sci. 2004 Jul;13(7):1787-801. doi: 10.1110/ps.04706204. Protein Sci. 2004. PMID: 15215522 Free PMC article.
References
-
- Berman H. M., Battistuz, T., Bhat, T. N., Bluhm, W. F., Bourne, P. E., Burkhardt, K., Feng, Z., Gilliland, G. L., Iype, L., Jain, S., et al. (2002) Acta Crystallogr. D 58, 899-907. - PubMed
-
- Bowie J. U., Lüthy, R. & Eisenberg, D. (1991) Science 253, 164-170. - PubMed
-
- Bryant S. H. & Lawrence, C. E. (1993) Proteins 16, 92-112. - PubMed
-
- Defay T. R. & Cohen, F. E. (1996) J. Mol. Biol. 262, 314-323. - PubMed
Publication types
MeSH terms
Substances
LinkOut - more resources
Full Text Sources
Other Literature Sources

