Comparative Study
. 2002 Dec 10;99(25):15977-82.
doi: 10.1073/pnas.202622299. Epub 2002 Dec 2.

Homology modeling of the cation binding sites of Na+K+-ATPase

Affiliations
Comparative Study

Homology modeling of the cation binding sites of Na+K+-ATPase

Haruo Ogawa et al. Proc Natl Acad Sci U S A. .

Abstract

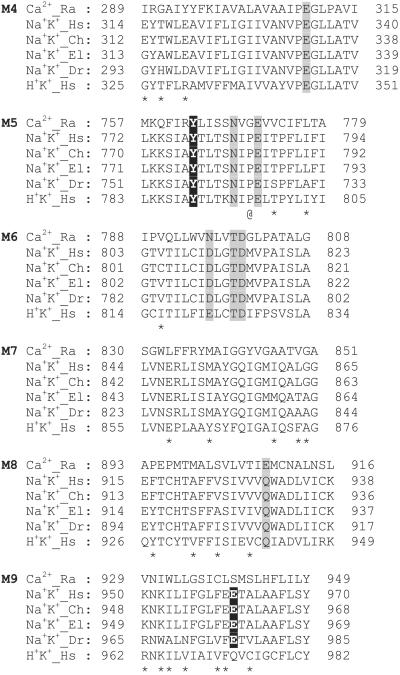
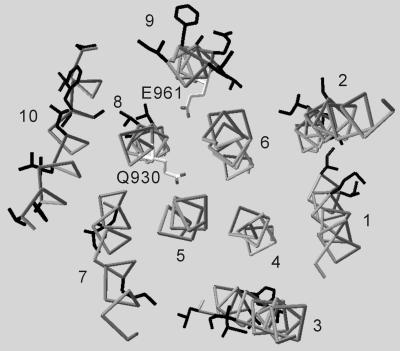
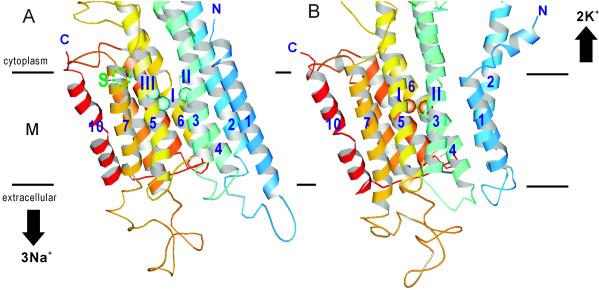
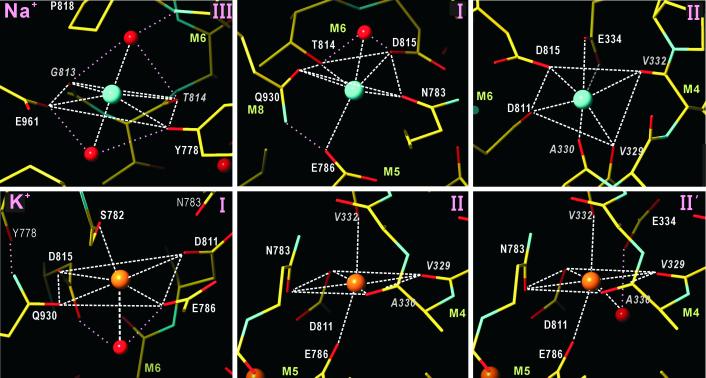
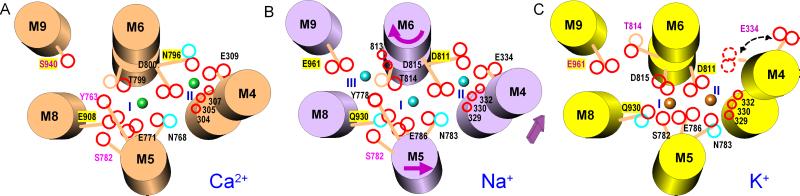
Homology modeling of the alpha-subunit of Na+K+-ATPase, a representative member of P-type ion transporting ATPases, was carried out to identify the cation (three Na+ and two K+) binding sites in the transmembrane region, based on the two atomic models of Ca2+-ATPase (Ca2+-bound form for Na+, unbound form for K+). A search for potential cation binding sites throughout the atomic models involved calculation of the valence expected from the disposition of oxygen atoms in the model, including water molecules. This search identified three positions for Na+ and two for K+ at which high affinity for the respective cation is expected. In the models presented, Na+- and K+-binding sites are formed at different levels with respect to the membrane, by rearrangements of the transmembrane helices. These rearrangements ensure that release of one type of cation coordinates with the binding of the other. Cations of different radii are accommodated by the use of amino acid residues located on different faces of the helices. Our models readily explain many mutational and biochemical results, including different binding stoichiometry and affinities for Na+ and K+.


Figures

Fig 1.
Fig 1.
Alignment of amino acid sequences of closely related P-type ATPases: Ca2+, sarco(endo)plasmic reticulum Ca2+-ATPase (SERCA1a); Na+K+, Na+K+-ATPase α subunit; H+K+, H+K+-ATPase α subunit. Only the transmembrane helices M4–M9 are shown. The residues for which side chain oxygens contribute to Ca2+ binding in Ca2+-ATPase (4) are shaded. The residues for which side chains contribute to Na+-binding site III in Na+K+-ATPase are shown in white letters against a black background. Asterisks indicate variable residues within the Na+K+-ATPases of different origins. @, The residue that functions as a pivot in the bending of M5 [Gly-750 in Ca2+-ATPase (5)]. Numbers flanking each amino acid sequence indicate the numbers of the residue at the start and end of the sequence. Hs, Homo sapiens; Ch, chicken; El, European eel; Dr, Drosophila melanogaster; Ra, rabbit.
Fig 2.
Fig 2.
Variable residues in the transmembrane part of the Na+K+-ATPase. The constructed model for the Na+-bound form is viewed roughly normal to the membrane from the cytoplasmic side. Transmembrane helices are numbered. Variable residues (shown in black) among Na+K+-ATPase of different origins are exposed to lipids, whereas Q930 (M8) and E961 (M9) orient toward the center of the transmembrane region.
Fig 3.
Fig 3.
Ribbon representation of the transmembrane part (M) of the constructed model of the Na+K+-ATPase in Na+- (A) and K+-bound (B) forms. α-Helices are numbered. Horizontal bars represent the boundaries of the hydrophobic core of the lipid bilayer. Cyan spheres in A represent Na+ ions (I–III), and orange spheres in B represent K+ ions (I and II). Site S, at which valence is slightly higher than 0.9, is also shown in A. Color changes gradually from the N terminus (N, blue) to the C terminus (C, red). Orientations of the models follow those of SERCA1a (5). Modeling of the cytoplasmic domains is not included in this figure. The figure was prepared with molscript (41).
Fig 4.
Fig 4.
Coordination geometry of Na+ and K+ in Na+K+-ATPase. Spheres represent Na+ (cyan), K+ (orange), and water (red). Dotted lines in pink show some of the potential hydrogen bonds. The Roman numeral in the top right corner refers to the binding site shown in Figs. 3 and 5. Site II′ for K+ is the same as site II, except for the contribution of Glu-334 through a water molecule.
Fig 5.
Fig 5.
Schematic diagrams for Ca2+-binding sites of Ca2+-ATPase (A), and Na+- (B) and K+-binding (C) sites of Na+K+-ATPase. The transmembrane helices (cylinders) are viewed from the cytoplasmic side. Arrows in B represent the directions of movements from Na+-bound (B) to K+-bound form (C); the arrow in C indicates two possible conformations of Glu-334. Cyan and orange spheres represent Na+ and K+, respectively. Red circles, oxygen atoms (carbonyl oxygen atoms appear smaller); blue circles, nitrogen; orange circles, carbon. Residue numbers with yellow background are those different between Ca2+-ATPase and Na+K+-ATPase α1. Residue numbers in pink specify those not directly involved in the coordination of the bound cation.

Similar articles

Cited by

References

    1. Glynn I. M. (1993) J. Physiol. 462, 1-30. - PMC - PubMed
    1. Kaplan J. H. (2002) Annu. Rev. Biochem. 71, 511-535. - PubMed
    1. Møller J. V., Jüul, B. & le Maire, M. (1996) Biochim. Biophys. Acta 1286, 1-51. - PubMed
    1. Toyoshima C., Nakasako, M., Nomura, H. & Ogawa, H. (2000) Nature 405, 647-655. - PubMed
    1. Toyoshima C. & Nomura, H. (2002) Nature 418, 605-611. - PubMed

Publication types