. 2002 Dec;137(8):1173-86.
doi: 10.1038/sj.bjp.0704989.

Antibodies and a cysteine-modifying reagent show correspondence of M current in neurons to KCNQ2 and KCNQ3 K+ channels

Affiliations

Antibodies and a cysteine-modifying reagent show correspondence of M current in neurons to KCNQ2 and KCNQ3 K+ channels

John P Roche et al. Br J Pharmacol. 2002 Dec.

Abstract

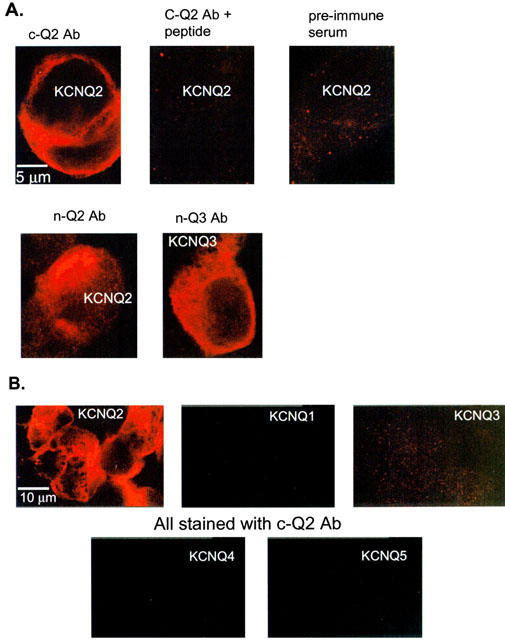
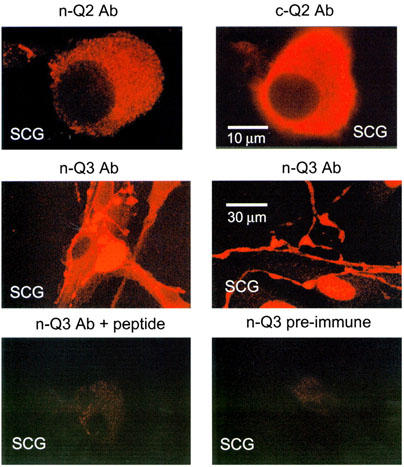
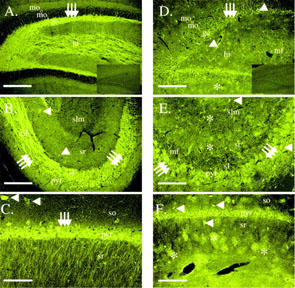
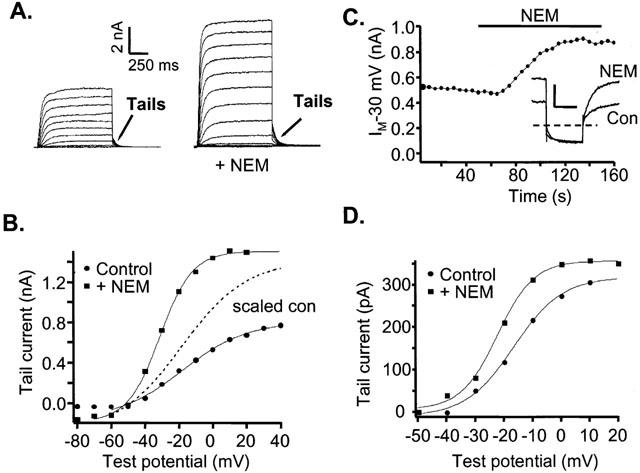
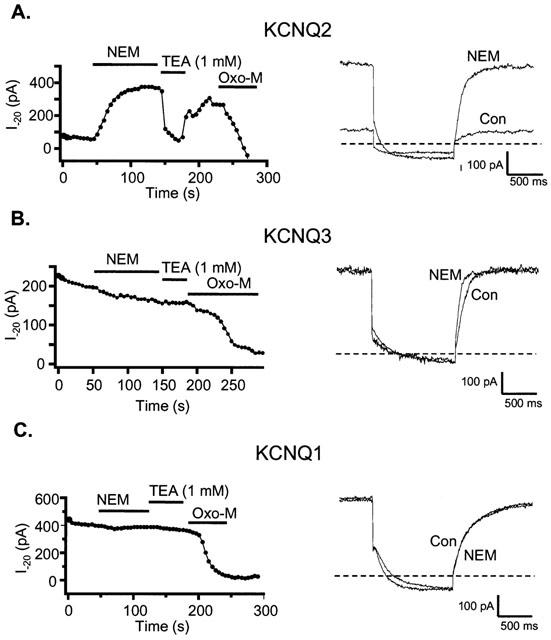
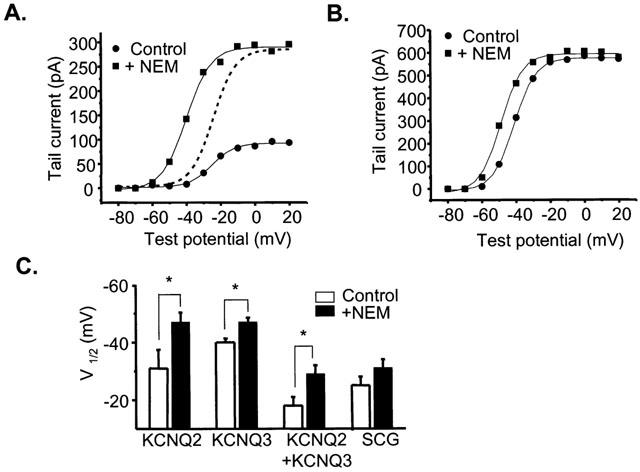
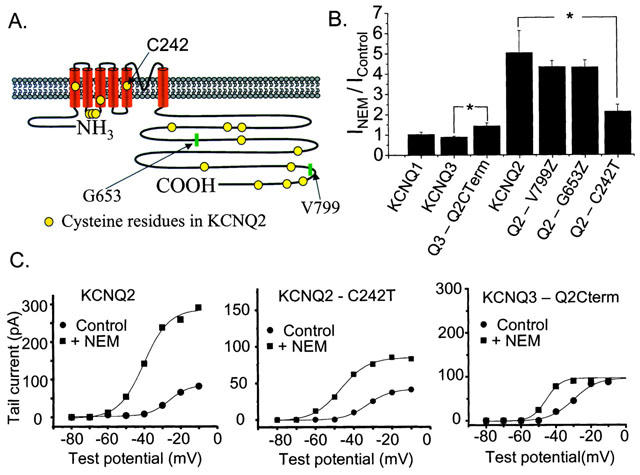
1. KCNQ K(+) channels are thought to underlie the M current of neurons. To probe if the KCNQ2 and KCNQ3 subtypes underlie the M current of rat superior cervical ganglia (SCG) neurons and of hippocampus, we raised specific antibodies against them and also used the cysteine-alkylating agent N-ethylmaleimide (NEM) as an additional probe of subunit composition. 2. Tested on tsA-201 (tsA) cells transfected with cloned KCNQ1-5 subunits, our antibodies showed high affinity and selectivity for the appropriate subtype. The antibodies immunostained SCG neurons and hippocampal sections at levels similar to those for channels expressed in tsA cells, indicating that KCNQ2 and KCNQ3 are present in SCG and hippocampal neurons. Some hippocampal regions contained only KCNQ2 or KCNQ3 subunits, suggesting the presence of M currents produced by channels other than KCNQ2/3 heteromultimers. 3. We found that NEM augmented M currents in SCG neurons and KCNQ2/3 currents in tsA cells via strong voltage-independent and modest voltage-dependent actions. Expression of individual KCNQ subunits in tsA cells revealed voltage-independent augmentation of KCNQ2, but not KCNQ1 nor KCNQ3, currents by NEM indicating that this action on SCG M currents likely localizes to KCNQ2. Much of the voltage-independent action is lost after the C242T mutation in KCNQ2. 4. The correspondence of NEM effects on expressed KCNQ2/3 and SCG M currents, along with the antibody labelling, provide further evidence that KCNQ2 and KCNQ3 subunits strongly contribute to the M current of neurons. The site of NEM action may be important for treatment of diseases caused by under-expression of these channels.


Figures

Figure 1
Figure 1
Immunostaining of KCNQ2 and KCNQ3 channels heterologously expressed in tsA cells. Confocal images of transiently transfected tsA cells labelled with antibodies to the amino-terminal of KCNQ2 (n-Q2), the carboxy-terminal of KCNQ2 (c-Q2), and the amino-terminal of KCNQ3 (n-Q3). The constructs transfected into the tsA cells are labelled in white on the appropriate panels. (A) Images of cells transfected with KCNQ2 top, bottom left) of KCNQ3 (bottom right) and immunostained with n-Q2 (bottom left) c-Q2 (top left), c-Q2 plus 1 μg/ml immunizing protein (top centre), or pre-immune serum (top right). The indicated scale bar applies to all panels. The gain settings used to acquire and process these images were identical. (B) Images of cells transfected individually with KCNQ1-5 and immunostained with the c-Q2 antibody. The indicated scale bar applies to all panels. For (A) and (B), the serum dilution was 1 : 1000.
Figure 2
Figure 2
SCG neurons express both KCNQ2 and KCNQ3. SCG cultures were prepared and immunostained with the KCNQ2 and KCNQ3 antibodies after 1–2 days in culture. The n-Q3 (centre row) antibodies strongly labelled the SCG neurons both at the soma and on neural processes. The staining as blocked by the immunizing protein used to make n-Q3 and the pre-immune antibody did not label the cells (bottom row, similar results for c-Q2 not shown). The cells were more weakly labelled by the n-Q2 antibody (top left) than by the c-Q2 antibody. The scale bar in the top right panel applies to the top row, and that in the middle right panel applies to the other panels.
Figure 3
Figure 3
KCNQ2 and KCNQ3 are labelled in the rat hippocampal formation. (A) Dentate gyrus stained with the n-Q2 antibody demonstrating intense staining of the granule cell layer and mossy fibers. The outer molecular layer is lightly stained while staining is absent from the inner molecular layer. moo, outer molecular layer, moi, inner molecular layer, gc, granule cell layer, hi, hilus. Arrows indicate granule cells. Scale bar is 300 μm. The inset shows labelling from the n-Q2 antibody pre-adsorbed with the immunizing peptide. (B) Regions CA3 and CA2 stained with the n-Q2 antibody demonstrating intense staining of the mossy fibers and their terminals and, to a lesser extent, pyramidal cells and interneurons. mf, mossy fibers, pyr, pyramidal cell layer, sl, stratum lucidum, sr, stratum radiatum, slm, stratum lacunosum-moleculare. Arrows indicate pyramidal cells. Arrowheads identify interneurons. Scale bar is 300 μm. (C) Region CA1. Pyramidal cells, their apical dendrites, and an occasional interneuron are moderately to strongly labelled. Scale bar corresponds to 120 μm. so, stratum oriens. Arrows identify pyramidal cells. Arrowheads identify interneurons. (D, E, F) Micrographs of KCNQ3 immunostaining in the rat hippocampal formation with the n-Q3 antibody. (D) Dentate region illustrating staining of astrocytes and interneurons in this region. Block of this labelling with the immunizing peptide is shown in the inset. Scale bar is 250 μm. (E) Region CA3. Moderate staining of astrocytes and scattered interneurons is evident. Pyramidal cells are diffusely labelled. Mossy fibers (stratum lucidum) do not appear to be stained. so, stratum oriens, pyr, pyramidal cell layer, sl, stratum lucidum, sr, stratum radiatum. Arrows indicate pyramidal cells. Arrowheads identify interneurons. Asterisks denote astrocytes. Scale bar is 120 μm. (F) Region CA1. Intense staining of scattered interneurons is evident. Pyramidal neurons and a population of astrocytes are less intensely stained. Lower levels of staining are apparent in the stratum lacunosum-moleculare. The neuropil of the stratum oriens and stratum radiatum is lightly stained. so, stratum oriens, pyr, pyramidal cell layer, sr, stratum radiatum, slm, stratum lacunosum-moleculare. Arrows indicate pyramidal cells. Arrowheads identify interneurons. Asterisks denote astrocytes. Scale bar is 250 μm.
Figure 4
Figure 4
NEM enhances amplitude and shifts the voltage dependence of homomeric KCNQ2/3 currents in tsA cells and M current in SCG neurons. (A) Currents in tsA cells expressing KCNQ2/3 subunits. Families of currents before (left) and after NEM (50 μM, 2 min) treatment (right), elicited by voltage steps in the range of −80 to +40 mV in 10 mV increments. (B) Activation curve for KCNQ2/3 channels expressed in tsA cells subunits before and after NEM application. Test potential steps range from −80 mV to +40 mV in 10 mV increments, followed by a step to −60 mV where tail-current amplitudes were measured. Tail currents were fitted by a single exponential, extrapolated to the beginning of the tail potential step, and the fitted amplitudes were plotted vs test potential. The data were fitted by Boltzmann equations of the form Itail=Imax/(1+exp(V1/2-V)/k), where Itail is the fitted tail current amplitude, Imax is the maximum current, V1/2 is the voltage at which the conductance is half-activated, and k is the slope factor. For the control curve, V1/2 and k were −18 and 19 mV, and for the NEM curve, they were −31 and 10 mV. The dotted curve (scaled con) is the fitted Boltzmann relation of the control data, scaled up so that the Imax is equal to that of the post-NEM curve. (C) Amplitudes of M currents in SCG neurons voltage-clamped to −30 mV and stepped repeatedly to −60 mV every 5 s. Filled circles represent the average current at −25 mV for the first 300 ms of a given sweep. Inset shows the current traces both before (con) and after NEM (NEM) treatment. Scale bars 500 pA, 300 ms. (D) Activation curve of M current in SCG neurons, obtained as for KCNQ2/3 currents in tsA cells, before and after application of NEM. Voltage steps range from −50 mV to +20 mV in 10 mV increments. The tail current potential was −60 mV. The data were fitted by Boltzmann equations as in (B). For the control curve, V1/2 and k were −16 and 8.5 mV, and for the NEM curve, they were −22 and 6.4 mV.
Figure 5
Figure 5
Augmentation of current by NEM is specific to the KCNQ2 subunit. TsA cells individually transfected with KCNQ2 (A), KCNQ3 (B) or KCNQ1 (C) subunits were voltage-clamped to −20 mV and stepped repeatedly to −70 mV every 5 s. Plotted as filled circles are the mean current amplitudes at −20 mV for the first 300 ms of each sweep. NEM (50 μM), TEA (1 mM) or oxo-M (10 μM) were bath-applied during the times indicated by the bars. The right hand panels show the current traces both before (con) and after NEM (NEM) treatment.
Figure 6
Figure 6
NEM-induces a hyperpolarizing shift in the V1/2 of activation of KCNQ channels. (A) Activation curve for tsA cells expressing KCNQ2 subunits before and after application of NEM. Voltage steps range from −80 mV to +40 mV in 10 mV increments. The tail current potential was −70 mV. The data were fitted by Boltzmann equations (solid lines) of the form Itail=Imax/(1+exp(V1/2-V)/k), where Itail is the fitted tail current amplitude, Imax is the maximum current, V1/2 is the voltage at which the conductance is half-activated, and k is the slope factor. The dotted curve is the fitted Boltzmann relation of the control data, scaled up so that the Imax is equal to that of the post-NEM curve. (B) Activation curve for tsA cells expressing KCNQ3 subunits before and after the application of NEM. Voltage steps range from −80 mV to +40 mV in 10 mV increments. The tail current potential was −70 mV. These data were also fitted by Boltzmann equations (solid lines) (C) Mean V1/2 of various KCNQ expressing cells as well as SCG neurons both before (open) and after NEM (filled) (*significant difference, Student's paired t-test, P⩽0.05).
Figure 7
Figure 7
Investigation of possible regions on KCNQ2 responsible for NEM action. (A) Diagram of the location of cysteine residues on the KCNQ2 subunit. (B) Mean NEM-induced augmentation of current amplitudes for homomeric channels made up of the construct indicated below the column (*represents significant difference, Student's t-test, P⩽0.05). (C) Activation curves for tsA cells expressing KCNQ2 (left), KCNQ2-C242T (middle), or the KCNQ3/2 chimera (right) before and after the application of NEM. Voltage steps range from −80 mV to 0 mV in 10 mV increments. The tail current potential was −70 mV.

References

    1. BERNHEIM L., BEECH D.J., HILLE B. A diffusible second messenger mediates one of the pathways coupling receptors to calcium channels in rat sympathetic neurons. Neuron. 1991;6:859–867. - PubMed
    1. BERNHEIM L., MATHIE A., HILLE B. Characterization of muscarinic receptor subtypes inhibiting Ca2+ current and M current in rat sympathetic neurons. Proc. Natl. Acad. Sci. U.S.A. 1992;89:9544–9548. - PMC - PubMed
    1. BIERVERT C., SCHROEDER B.C., KUBISCH C., BERKOVIC S.F., PROPPING P., JENTSCH T.J., STEINLEIN O.K. A potassium channel mutation in neonatal human epilepsy. Science. 1998;279:403–406. - PubMed
    1. BROWN D.A., GAHWILER B.H., GRIFFITH W.H., HALLIWELL J.V. Membrane currents in hippocampal neurons. Prog. Brain Res. 1990;83:141–160. - PubMed
    1. CHARLIER C., SINGH N.A., RYAN S.G., LEWIS T.B., REUS B.E., LEACH R.J., LEPPERT M. A pore mutation in a novel KQT-like potassium channel gene in an idiopathic epilepsy family. Nat. Genet. 1998;18:53–55. - PubMed

Publication types

MeSH terms