. 2002 Dec;12(12):1805-14.
doi: 10.1101/gr.631202.

Interrogating a high-density SNP map for signatures of natural selection

Affiliations

Interrogating a high-density SNP map for signatures of natural selection

Joshua M Akey et al. Genome Res. 2002 Dec.

Abstract

Identifying genomic regions that have been targets of natural selection remains one of the most important and challenging areas of research in genetics. To this end, we report an analysis of 26,530 single nucleotide polymorphisms (SNPs) with allele frequencies that were determined in three populations. Specifically, we calculated a measure of genetic differentiation, F(ST), for each locus and examined its distribution at the level of the genome, the chromosome, and individual genes. Through a variety of analyses, we have found statistically significant evidence supporting the hypothesis that selection has influenced extant patterns of human genetic variation. Importantly, by contrasting the F(ST) of individual SNPs to the empirical genome-wide distribution of F(ST), our results are not confounded by tenuous assumptions of population demographic history. Furthermore, we have identified 174 candidate genes with distribution of genetic variation that indicates that they have been targets of selection. Our work provides a first generation natural selection map of the human genome and provides compelling evidence that selection has shaped extant patterns of human genomic variation.


Figures

Figure 1
Figure 1
The effect of genotyping errors on estimates of FST. The genotyping error rates μ and ν were assumed to be equal (see Methods for details).
Figure 2
Figure 2
Genome-wide distribution of FST. Solid bars show the observed distribution of FST for 25,549 autosomal SNPs. The X chromosome was not included in this analysis because it has a different effective population size compared with that of autosomal markers. Lightly shaded bars represent the simulated distribution of FST. The inset figure shows the observed and simulated distributions of FST for values ≥0.5.
Figure 3
Figure 3
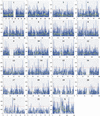
Chromosomal distribution of FST. For each chromosome, chromosomal position in Mb is shown on the X-axis, and FST is plotted on the Y-axis. FST values for individual SNPs are shown in blue, and the average FST for nonoverlapping 1 Mb bins is plotted in yellow. The red horizontal lines in each panel provide a guide for identifying exceptionally high-FST values (corresponding to the upper 2.5% of the empirical distribution of FST; notice the higher threshold for the X chromosome). SNP density is proportional to the line spacing, and although the overall density is high, several large gaps were observed (e.g., see chromosomes 1, 9, 16, and 20). These gaps correspond to heterochromatic staining regions found near the centromeres of these chromosomes. The Y chromosome contained only seven SNP markers with allele frequency data and therefore was not included in subsequent analyses.
Figure 4
Figure 4
Correlation between FST values as a function of physical distance. Intermarker distance was calculated between adjacent SNPs across the genome. Marker pairs were then separated into various bins (shown on the X-axis) according to their intermarker distance, and ρ was calculated for each bin. In the observed data, ρ was calculated for unlinked markers by comparing FST values on different chromosomes. Vertical bars represent 95% confidence intervals.
Figure 5
Figure 5
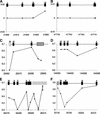
FST profiles for six genes showing signatures of natural selection. For each gene, FST is plotted on the Y-axis, and chromosomal position in Kb is plotted on the X-axis. The genes shown here include guanine nucleotide exchange factor for Rap1 (GFR; (A)), tropomodulin 3 (TMOD3; (B)), apolipoprotein B (APOB; (C)), phosphoinositide-3-kinase, catalytic, β-polypeptide (PIK3CB; (D)), cytidine monophosphate-N-acetylneuraminic acid hydroxylase (CMAH; (E)), and oligophrenin 1 (OPHN1; (F)). The location of SNPs within each gene is denoted as boxes: introns (black), exons (open), 5′ UTR (grey), 5′ upstream (vertically striped), and 3′ downstream (hatched). Intron and exon numbers are noted within each box where appropriate.

References

    1. Akey JM, Zhang K, Xiong M, Doris P, Jin L. The effect that genotyping errors have on the robustness of common linkage-disequilibrium measures. Am J Hum Genet. 2001;68:1447–1456. - PMC - PubMed
    1. Altshuler D, Pollar VJ, Cowles CR, Van Etten WJ, Baldwin J, Linton L, Lander ES. A SNP map of the human genome generated by reduced representation shotgun sequencing. Nature. 2000;407:513–516. - PubMed
    1. Andolfatto P. Adaptive hitchhiking effects on genome variability. Curr Opin Genet Dev. 2001;11:635–641. - PubMed
    1. Aquadro CF, Bauer DuMont V, Reed FA. Genome-wide variation in the human and fruitfly: A comparison. Curr Opin Genet Dev. 2001;1:627–634. - PubMed
    1. Ashburner M, Ball CA, Blake JA, Botstein D, Butler H, Cherry JM, Davis AP, Dolinski K, Dwight SS, Eppig JT, et al. Gene ontology: Tool for the unification of biology: The Gene Ontology Consortium. Nat Genet. 2000;25:25–29. - PMC - PubMed

Publication types

Substances

LinkOut - more resources