

Haplotype and linkage disequilibrium architecture for human cancer-associated genes
- PMID: 12466288
- PMCID: PMC187564
- DOI: 10.1101/gr.483802
Haplotype and linkage disequilibrium architecture for human cancer-associated genes
Abstract
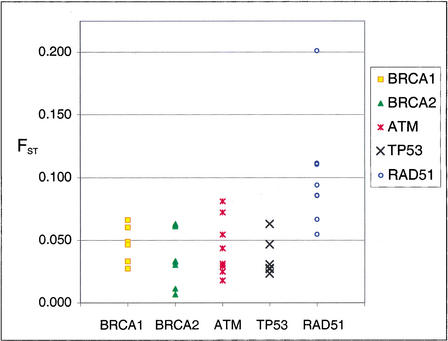
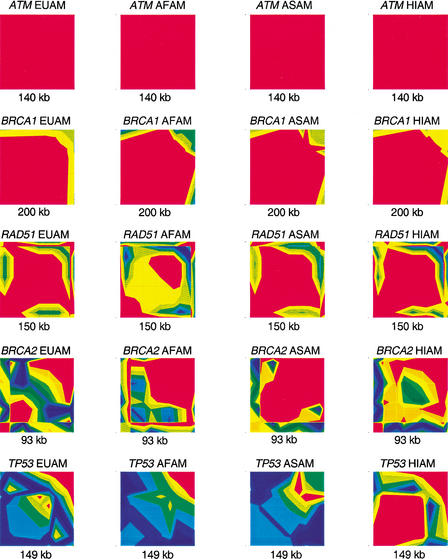
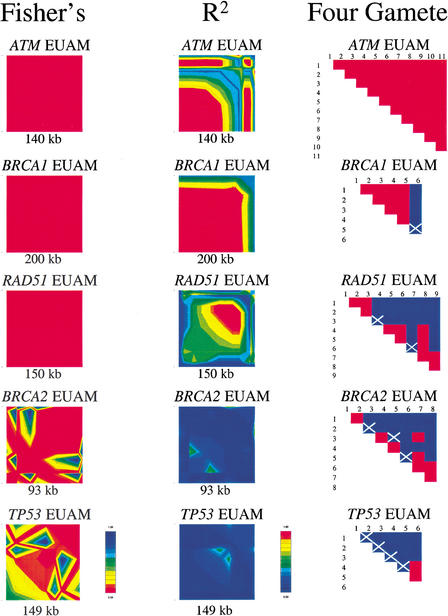
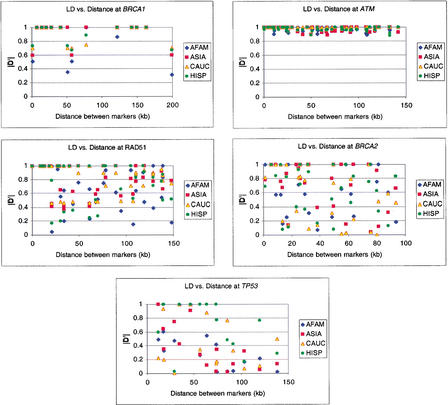
To facilitate association-based linkage studies we have studied the linkage disequilibrium (LD) and haplotype architecture around five genes of interest for cancer risk: ATM, BRCA1, BRCA2, RAD51, and TP53. Single nucleotide polymorphisms (SNPs) were identified and used to construct haplotypes that span 93-200 kb per locus with an average SNP density of 12 kb. These markers were genotyped in four ethnically defined populations that contained 48 each of African Americans, Asian Americans, Hispanic Americans, and European Americans. Haplotypes were inferred using an expectation maximization (EM) algorithm, and the data were analyzed using D', R(2), Fisher's exact P-values, and the four-gamete test for recombination. LD levels varied widely between loci from continuously high LD across 200 kb to a virtual absence of LD across a similar length of genome. LD structure also varied at each gene and between populations studied. This variation indicates that the success of linkage-based studies will require a precise description of LD at each locus and in each population to be studied. One striking consistency between genes was that at each locus a modest number of haplotypes present in each population accounted for a high fraction of the total number of chromosomes. We conclude that each locus has its own genomic profile with regard to LD, and despite this there is the widespread trend of relatively low haplotype diversity. As a result, a low marker density should be adequate to identify haplotypes that represent the common variation at a locus, thereby decreasing costs and increasing efficacy of association studies.
Figures
References
-
- Abecasis GR, Cookson WO. GOLD—Graphical overview of linkage disequilibrium. Bioinformatics. 2000;16:182–183. - PubMed
-
- Chakraborty R. Gene admixture in human populations: Models and predictions. Yearbook Phys Anthropol. 1986;29:1–43.
Publication types
MeSH terms
Substances
Grants and funding
LinkOut - more resources
Full Text Sources
Other Literature Sources
Research Materials
Miscellaneous