Comparative Study
. 2002 Dec;12(12):1921-8.
doi: 10.1101/gr.670002.

Gene expression profiling of embryo-derived stem cells reveals candidate genes associated with pluripotency and lineage specificity

Affiliations
Comparative Study

Gene expression profiling of embryo-derived stem cells reveals candidate genes associated with pluripotency and lineage specificity

Tetsuya S Tanaka et al. Genome Res. 2002 Dec.

Abstract

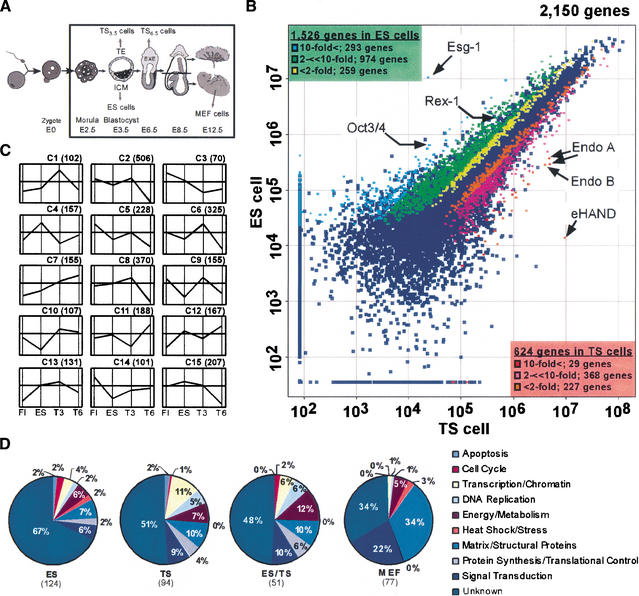
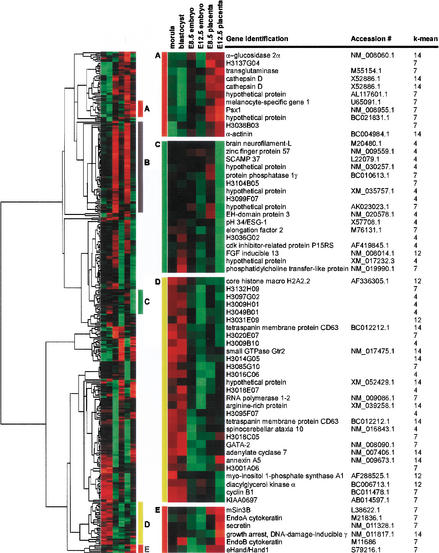
Large-scale gene expression profiling was performed on embryo-derived stem cell lines to identify molecular signatures of pluripotency and lineage specificity. Analysis of pluripotent embryonic stem (ES) cells, extraembryonic-restricted trophoblast stem (TS) cells, and terminally-differentiated mouse embryo fibroblast (MEF) cells identified expression profiles unique to each cell type, as well as genes common only to ES and TS cells. Whereas most of the MEF-specific genes had been characterized previously, the majority (67%) of the ES-specific genes were novel and did not include known differentiated cell markers. Comparison with microarray data from embryonic material demonstrated that ES-specific genes were underrepresented in all stages sampled, whereas TS-specific genes included known placental markers. Investigation of four novel TS-specific genes showed trophoblast-restricted expression in cell lines and in vivo, whereas one uncharacterized ES-specific gene, Esg-1, was found to be exclusively associated with pluripotency. We suggest that pluripotency requires a set of genes not expressed in other cell types, whereas lineage-restricted stem cells, like TS cells, express genes predictive of their differentiated lineage.


Figures

Figure 1
Figure 1
(A) Schematic representation of tissues and cell lines used for microarray hybridization experiments and Northern analysis. Embryos, tissue types, and cell lines in the rectangle were used in this study. (B) Scatter-plot analysis of ES versus TS6.5 cells microarray experiment. Average expression levels (arbitrary units) of each gene were calculated from three independent hybridizations. Genes that show significantly different expression levels between ES and TS6.5 cells at the 5% significance level (P < 0.05) with expression levels above the background are displayed as colored spots, and the other genes are displayed as dark blue spots. For genes that are expressed higher in ES cells than in TS6.5 cells, blue indicates genes expressed greater than 10-fold, green indicates those expressed between two- and 10-fold, and yellow indicates those expressed less than twofold. For genes that are expressed higher in TS6.5 cells than in ES cells, red indicates genes expressed greater than 10-fold, pink indicates those expressed between two- and 10-fold, and orange indicates those expressed less than twofold. Several examples of genes are indicated. (C) k-means cluster-analysis of differentially expressed genes among ES, TS3.5, TS6.5, and MEF at a 5% significance level (P < 0.05). By using the k-means algorithm, 2,969 genes were grouped into 15 distinct clusters based on their similarities of expression patterns among ES, TS3.5, TS6.5, and MEF. The name of individual clusters is indicated, followed in parentheses with the number of genes in each cluster. Only statistically significant, sequence-validated genes are represented here. (D) Functional classifications of ES-, TS-, MEF-, and stem cell-specific genes. The number of genes identified as specific to the cell type is indicated within parentheses. Annotated genes were classified by their function (Kargul et al. 2001), and are indicated on the right with its color co-ordinate. The unknown category includes sequences that are in the database but have yet to be characterized, as well as completely novel sequences.
Figure 2
Figure 2
List of genes showing unique cluster-patterns. Based on hierarchical clustering of 346 genes expressed specifically in either ES, TS, MEF, or in stem cells, we could identify five distinct clusters: Clusters A and E are for extraembryonic cell-lineage-specific clusters; B is for an E8.5 stage-specific cluster; C is a low expression cluster; D is for preimplantation embryo-specific cluster. Lists of genes in these clusters are shown. Cluster 4 in k-means analysis indicates that the gene is ES cell-specific, number 7 is for TS cell-specific, 14 is for MEF-specific, and 12 is for genes commonly expressed in both ES and TS cells.
Figure 3
Figure 3
(A, top) Three previously uncharacterized clones showing statistically significant high expression in TS6.5 cells were used as probes for Northern blots. The probe for β-actin was used as a control. (Middle) DNA probe for H3138C09 showed E12.5 placenta-specific signal by Northern hybridization. The probe for β-actin was used as a control. (Bottom) Schematic representation of one novel TS-specific gene, TC527107, from the TIGR Gene Index (Quackenbush et al. 2001). The cDNA clone H3138C09 is localized to the 3′UTR of this gene. See text for details. (B, top) Total RNA was extracted from extraembryonic and embryonic parts at the different stages indicated and transferred onto nylon membranes, which were probed with either H3001A06 or β-actin and exposed for 8 d to a Phosphorscreen. (Middle) DIG-labeled RNA probe for H3001A06 was hybridized in situ to a section of E9.5 conceptus. (Bottom left) HE-staining shows three different layers of the placenta at E11.5. Bottom right: DIG-labeled RNA probe for H3001A06 was hybridized in situ to a section of E11.5 placenta. The signals were weak, but detectable in the spongiotrophoblast and labyrinthine trophoblast layers, but undetectable in surrounding decidua. (TG2) Secondary trophoblast giant cells; (De) decidua; (P1) placenta; (A1) allantois; (Ex) exocoelom; (vYS) visceral yolk sac; (Sp) spongiotrophoblast layer; (La) labyrinthine trophoblast layer.
Figure 4
Figure 4
(A) Northern hybridization of Esg-1. (Left) Total RNA from ES, TS3.5, TS6.5, and MEF cells were blotted onto a nylon membrane. The image of ribosomal RNA is shown as a loading control. (Right) poly(A)+ RNA from multiple cell-lines were blotted onto a nylon membrane (Clontech). Cell lines used for this blot are (1) neuroblastoma NB41A3; (2) mastocytoma P815; (3) lymphoma P388D1; (4) lymphocytic leukemia L1210; (5) lymphoma R1.1; (6) hepatoma Hepa1–6; (7) embryonic carcinoma P19; (8) subcutaneous connective tissue-type L-M; (9) fibroblast M-MSVBALB/3T3; (10) fibroblast k-BALB; (11) Abelson murine leukemia virus-induced tumor RAW264.7; (12) lymphoid tumor PU5–1.8. (B–D) Semi-quantitative RT-PCR analysis in preimplantation embryos. Primer pair for EF1α was used as a loading control. (B) Expression patterns of Esg-1 and Oct3/4 were examined in unfertilized eggs (UN; 278 eggs), fertilized eggs (1; 248 zygotes), and preimplantation embryos at stages of 2-, 4-, and 8-cells (289, 312, and 181 embryos, respectively), morula (M; 144 embryos), and blastocyst (B; 175 embryos). It was confirmed that RT negative controls of each sample gave no PCR products. Only RT negative control of blastocyst (−) is shown. Each cDNA was first adjusted to one egg or one embryo-equivalent and then serially diluted as indicated to the right. (C) Early zygotic transcription-dependent expression of Esg-1 was confirmed by α-amanitin treatment of fertilized eggs. Fertilized eggs with a polar body were collected at 27 h post-hCG injection and either uncultured (1; 313 zygotes), or cultured for 18 h in M16 with (+; 207 embryos) or without (−; 230 embryos) 100 μg/mL α-amanitin. Two-cell stage embryos (vivo; 226 embryos) were also collected directly from oviducts in parallel. Serially-diluted cDNAs were used as indicated to the right. Embryos were pooled from four series of experiments. Hsp70.1 was used as a positive control. On average, 75% and 67% of the fertilized eggs developed to two-cell stage embryos in the absence and presence of α-amanitin, respectively. (D) Expression level of Esg-1 in the ICM and TE was investigated by direct isolation of the ICM and TE by immunosurgery and FITC-ConA labeling followed by trypsinization, respectively. A combination of serial dilution of cDNAs and different PCR-cycles were indicated. Fgf4 and Oct3/4 were known to be expressed in the ICM, whereas EndoA is a marker of the TE (Brulet and Jacob 1982). (E) Real-time RT-PCR analysis of Esg-1 and Oct3/4 in manipulated ES cells. Two manipulated ES cell-lines either expressing active Stat3 conditionally, or suppressing Oct3/4 conditionally were used as sources of RNA. MEF cells were used as a negative control. The expression level of Oct3/4 was also measured as a marker of pluripotency. The expression levels of Esg-1 and Oct3/4 were normalized to those of EF1α, whose constant expression levels over different conditions were verified (data not shown). The levels of Esg-1 and Oct3/4 in the manipulated cell lines were compared with those of nonmanipulated ES cells grown under standard conditions.

References

    1. Abe K, Ko MSH, MacGregor GR. A systematic molecular genetic approach to study mammalian germline development. Int J Dev Biol. 1998;42:1051–1065. - PMC - PubMed
    1. Adinolfi S, Bagni C, Castiglione Morelli MA, Fraternali F, Musco G, Pastore A. Novel RNA-binding motif: The KH module. Biopolymers. 1999;51:153–164. - PubMed
    1. Astigiano S, Barkai U, Abarzua P, Tan SC, Harper MI, Sherman MI. Changes in gene expression following exposure of nulli-SCCl murine embryonal carcinoma cells to inducers of differentiation: Characterization of a down-regulated mRNA. Differentiation. 1991;46:61–67. - PubMed
    1. Beddington RS, Robertson EJ. An assessment of the developmental potential of embryonic stem cells in the midgestation mouse embryo. Development. 1989;105:733–737. - PubMed
    1. Bierbaum P, MacLean-Hunter S, Ehlert F, Moroy T, Muller R. Cloning of embryonal stem cell-specific genes: Characterization of the transcriptionally controlled gene esg-1. Cell Growth Differ. 1994;5:37–46. - PubMed

Publication types

MeSH terms