. 2002 Dec 10;99(25):16018-23.
doi: 10.1073/pnas.252458399. Epub 2002 Dec 4.

Scanning surface confocal microscopy for simultaneous topographical and fluorescence imaging: application to single virus-like particle entry into a cell

Affiliations

Scanning surface confocal microscopy for simultaneous topographical and fluorescence imaging: application to single virus-like particle entry into a cell

J Gorelik et al. Proc Natl Acad Sci U S A. .

Abstract

We have developed a method for simultaneous recording of high-resolution topography and cell surface fluorescence in a single scan which we call scanning surface confocal microscopy. The resolution of the system allows imaging of individual fluorescent particles in the nanometer range on fixed or live cells. We used this technique to record the interaction of single virus-like particles with the cell surface and demonstrated that single particles sink into the membrane in invaginations reminiscent of caveolae or pinocytic vesicles. This method provides a technique for elucidating the interaction of individual viruses and other nanoparticles, such as gene therapy vectors, with target cells. Furthermore, this technique should find widespread application for studying the relationship of fluorescently tagged molecules with components of the cell plasma membrane.


Figures
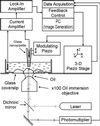
Fig 1.
Fig 1.
Schematic diagram of the SSCM.
Fig 2.
Fig 2.
Comparison of surface confocal and conventional confocal microscopy. (A) Principle of SSCM. Optical and topographical contouring with an SSCM. The dotted line indicates the position of the optical image of the cell surface obtained in a single scan. (B) Overlay of simultaneously obtained topographic and fluorescence images of fluorescent Cy3-labeled VLPs adsorbed to the surface of COS 7 cells. (C) Optical sectioning with a conventional scanning confocal microscope. Dotted lines indicate positions of multiple optical sections required to generate an image of the cell surface. (D) Sum of eight confocal sections of the same sample as shown in B. (E) Single surface confocal microscopy scan of the same sample as shown in B, projected on a flat surface.
Fig 3.
Fig 3.
Imaging live cells. Live COS 7 cells were sequentially scanned by SSCM approximately every 20 min for 4 h. Shown are topographical scans initiated at 0 min and 54 min and overlays of simultaneously obtained topographic and fluorescence scans at 2 h 17 min, 2 h 44 min, 3 h 2 min, 3 h 20 min, 3 h 37 min, and 3 h 55 min, respectively. Scanning for fluorescence was initiated at 2 h 17 min (red star); fluorescent VLPs were added at 2 h 40 min (VLPs). Fluorescence is represented as an intensity profile: black, lowest intensity; red, highest intensity. A slowly moving spot is clearly visible near the center of SSCM images at 3 h 2 min, 3 h 20 min, and 3 h 37 min (last remaining fluorescent spot in the image at 3 h 37 min).
Fig 4.
Fig 4.
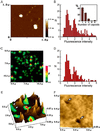
Detection of single VLP entry. (A) AFM image of typical preparation of fluorescent Cy3-labeled VLPs on mica. (B) Fluorescence intensity distribution of VLPs on glass calculated from confocal images. (Inset) Distribution of VLPs in aggregates based on the AFM measurements of 33 aggregates of VLPs. (C) Surface confocal fluorescence image of VLPs on the cell membrane. (D) Fluorescence intensity distribution of VLPs on the cell membrane obtained from surface confocal images. (E) A 3D representation of a combination of surface confocal and SICM images of high resolution of the region marked with white box in C. Microvilli are visible as pale brown protrusions on the surface. (F) A zoomed topographic image acquired from the data gathered in the scan represented in E (a region containing two VLPs; arrows).

Similar articles

Cited by

References

    1. Chimini G. & Chavrier, P. (2000) Nat. Cell Biol. 2, E191-E196. - PubMed
    1. Godbey W. T., Wu, K. K. & Mikos, A. G. (1999) Proc. Natl. Acad. Sci. USA 96, 5177-5181. - PMC - PubMed
    1. Sieczkarski S. B. & Whittaker, G. R. (2002) J. Gen. Virol. 83, 1535-1545. - PubMed
    1. Zabner J., Fasbender, A. J., Moninger, T., Poellinger, K. A. & Welsh, M. J. (1995) J. Biol. Chem. 270, 18997-19007. - PubMed
    1. Bartlett J. S. & Samulski, R. J. (1998) Nat. Med. 4, 635-637. - PubMed

Publication types

LinkOut - more resources