

Food intake, water intake, and drinking spout side preference of 28 mouse strains
- PMID: 12467341
- PMCID: PMC1397713
- DOI: 10.1023/a:1020884312053
Food intake, water intake, and drinking spout side preference of 28 mouse strains
Abstract
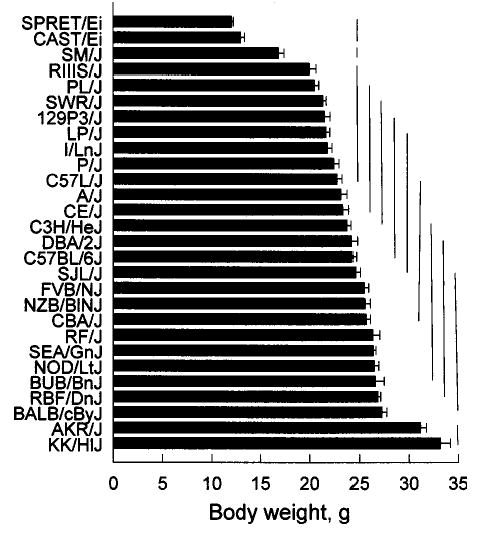
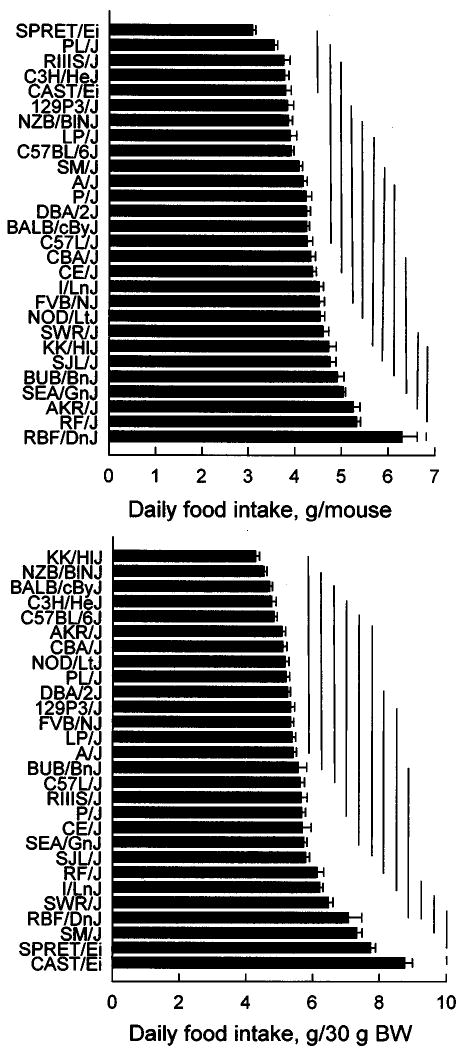
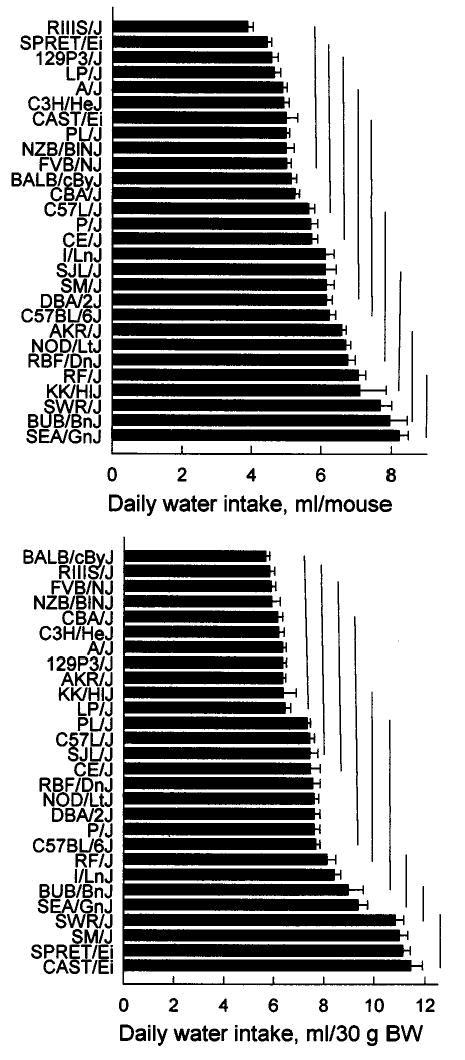
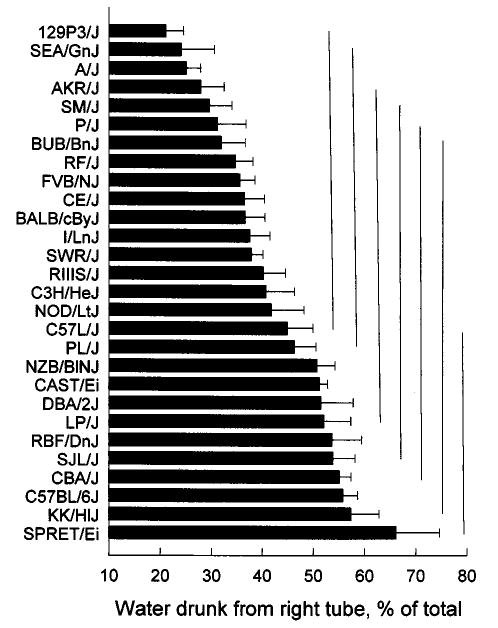
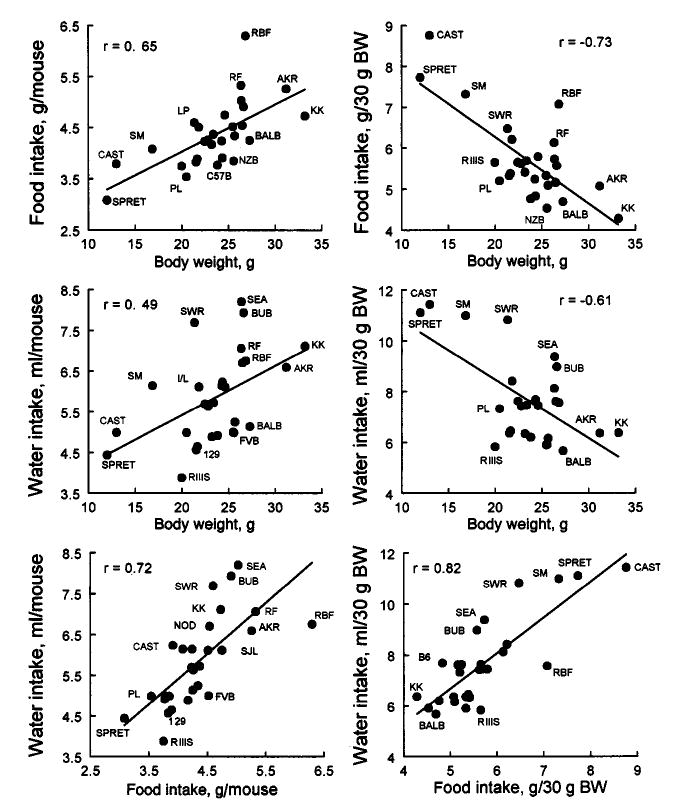
Male mice from 28 inbred strains (129P3/J, A/J, AKR/J, BALB/cByJ, BUB/BnJ, C3H/HeJ, C57BL/6J, C57L/J, CAST/Ei, CBA/J, CE/J, DBA/2J, FVB/NJ, I/LnJ, KK/H1J, LP/J, NOD/LtJ, NZB/B1NJ, P/J, PL/J, RBF/DnJ, RF/J, RIIIS/J, SEA/GnJ, SJL/J, SM/J, SPRET/Ei, and SWR/J) were fed chow and had access to two water bottles. Body weight, food intake, water intake, and drinking spout side preference were measured. There were large strain differences in all the measures collected, with at least a two-fold difference between strains with the lowest and the highest trait values. Estimates of heritability ranged from 0.36 (spout side preference) to 0.87 (body weight). Body weight, food intake, and water intake were interrelated among the strains, although substantial strain variation in food and water intakes independent from body weight was present. The strain differences described here provide useful information for designing mutagenesis screens and choosing strains for genetic mapping studies.
Figures
References
-
- Allometric Equations, http://www.epa.gov/ncea/pdfs/allometr.pdf National Center for Environmental Assessment of the Environmental Protection Agency, Washington, DC.
-
- Allison DB, Paultre F, Goran MI, Poehlman ET, Heymsfield SB. Statistical considerations regarding the use of ratios to adjust data. Int J Obes Relat Metab Disord. 1995;19:644–652. - PubMed
-
- Altman, P. L., and Katz, D. D. (1979). Inbred and Genetically Defined Strains of Laboratory Animals, Part 1, Mouse and Rat Federation of American Societies for Experimental Biology, Bethesda, MD.
Publication types
MeSH terms
Grants and funding
LinkOut - more resources
Full Text Sources
Other Literature Sources
Molecular Biology Databases
Miscellaneous