

doi: 10.1016/s0896-6273(02)01067-x.
Adenosine: a neuron-glial transmitter promoting myelination in the CNS in response to action potentials
Affiliations
- PMID: 12467589
- PMCID: PMC1201407
- DOI: 10.1016/s0896-6273(02)01067-x
Item in Clipboard
Adenosine: a neuron-glial transmitter promoting myelination in the CNS in response to action potentials
Neuron.
.
Abstract
Neuronal activity influences myelination of the brain, but the molecular mechanisms involved are largely unknown. Here, we report that oligodendrocyte progenitor cells (OPCs) express functional adenosine receptors, which are activated in response to action potential firing. Adenosine acts as a potent neuron-glial transmitter to inhibit OPC proliferation, stimulate differentiation, and promote the formation of myelin. This neuron-glial signal provides a molecular mechanism for promoting oligodendrocyte development and myelination in response to impulse activity and may help resolve controversy on the opposite effects of impulse activity on myelination in the central and peripheral nervous systems.
Figures
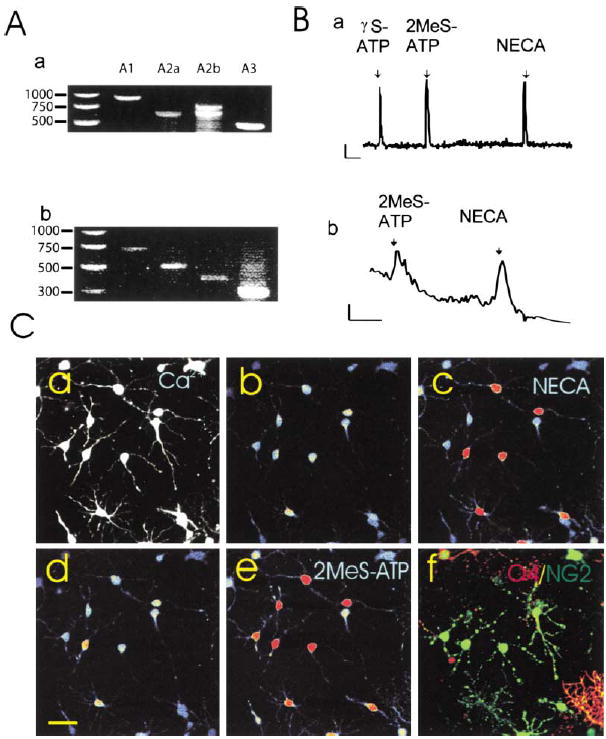
(A) mRNAs for all major classes of adenosine receptors were detected by RT-PCR in rat OPCs after 2 days in culture (a) and in mouse OPCs freshly isolated by fluorescence activated cell sorting (b). Species-specific primers yielded different size products as well as double bands for rat A2b due to alternate splicing (Kreisberg et al., 1997). (B) Functional purinergic receptors linked to Ca2+ signaling were detected by intracellular Ca2+ imaging in response to ATP receptor agonists (γS-ATP and 2MeS-ATP, 100μM) and adenosine receptor agonists (NECA, 100 μM and adenosine [data not shown]) in individual rat OPCs in culture (a) and OPCs freshly isolated from mice expressing the CNP-GFP transgene (b). Indo-1 was used to measure Ca2+ responses in acutely isolated cells to avoid fluorescence from GFP. Note: Indo-1 is less sensitive than fluo-3. Scale = 10ΔF/F/2 min. (C) Oligodendroglial cells at both the immature NG2+ stage and more differentiated O4+ stage showed intracellular calcium responses to ATP and adenosine receptor agonists, and often responses to both receptor agonists were seen in the same cell. Cells were filled with fluo-3, a calcium-sensitive fluorescent dye (a), and responses to a specific adenosine receptor agonist (b and c) and an ATP receptor agonist (d and e) were recorded in the same cells using time-lapse confocal microscopy. (Higher concentrations of intra-cellular calcium are indicated in warmer colors.) At the completion of the calcium-imaging experiment, the identical cells were double stained with antibodies against NG2 (green) and O4 (red), and examined by confocal microscopy (f). All the cells in this field were either NG2 and/or O4+ oligodendroglial cells. Of the 17 cells in this microscope field, 11 responded to the adenosine receptor agonist NECA (100 μM), 13/17 responded to the ATP receptor agonist 2MeS-ATP (100 μM), 11/17 cells responded to both agonists, and 4/17 cells showed no measurable response to either agonist.
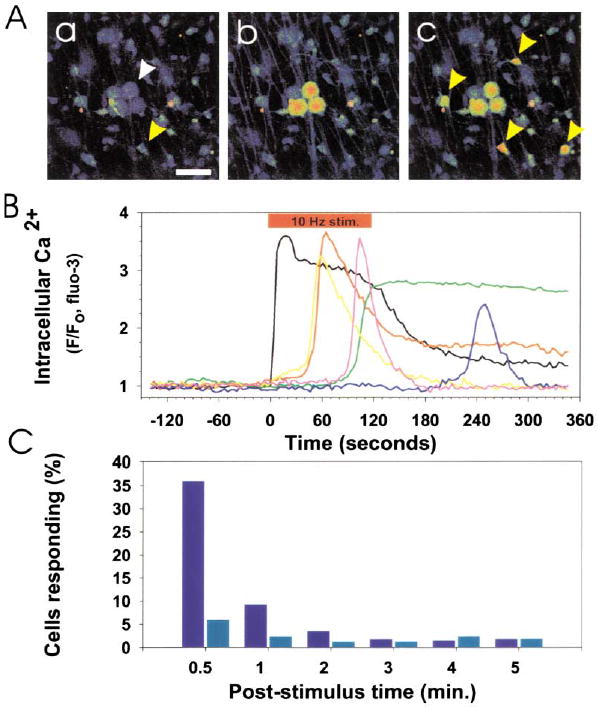
(A) Prior to action potential firing, Ca2+ levels were low in DRG neurons (white arrow) and OPCs (yellow arrow) in coculture (a). Scale bar = 50 μm. Action potentials were induced in DRG axons by electrical stimulation (10 Hz), causing an instantaneous rise in cytoplasmic Ca2+ in the cell body and axons of DRG neurons (b). This was followed by responses in many OPCs (yellow arrows) after several seconds (c). The fluorescence intensity of individual DRG neurons and OPCs in (A) is plotted in (B). 10 Hz electrical stimulation (red bar), cytoplasmic Ca2+ in DRG neurons (black trace), Ca2+ response in OPCs (color traces). No responses to electrical stimulation were seen in OPCs in cultures made without neurons. (C) Incubation with a combination of antagonists of ATP (30 μM suramin) and adenosine receptors (30 μM MRS-1191 and 200 μM DPCPX) inhibited action-potential induced Ca2+ responses in OPCs. A poststimulus time histogram, summarizing the proportion of OPCs responding to action potential firing in the presence (light blue) and absence (dark blue) of these purinergic receptor inhibitors, indicates a significant reduction in short latency (<0.5 min; p < 0.001, χ2, n = 455) and long-latency OPC responses (0.5–5 min; p < 0.02, χ2, n = 455) when purinergic receptors were blocked.
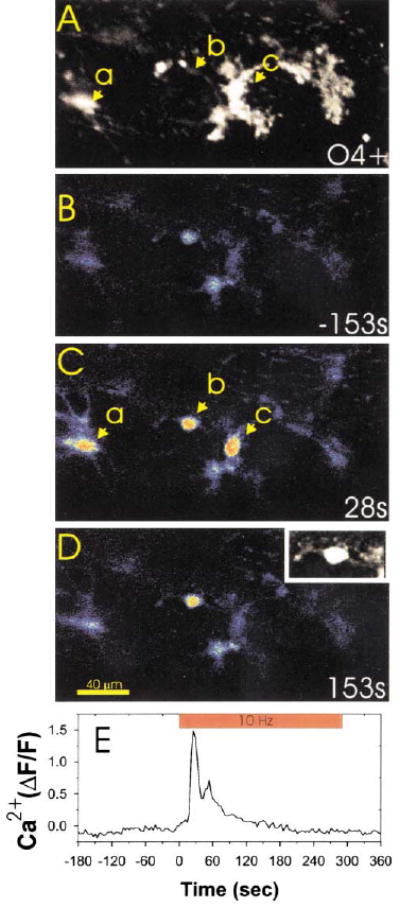
Immunocytochemical staining for the O4 antigen (A) was used after confocal calcium imaging (B–D) to determine the developmental stage at which OPCs responded to action potentials in DRG axons. Three OPCs in this microscope field (a, b, and c) responded to action potentials induced in DRG axons by electrical stimulation. Examination of the same field after O4 staining (A) indicated that OPCs at both the bipolar/O4− stage (cell b and also shown in (D) inset) and O4+ stage (cells a and c in [A] and [C]) responded to axonal firing with large increases in intracellular calcium. Changes in intracellular calcium in cell b are plotted with respect to the time of axonal stimulation in (E). The inset in (D) is an enlargement of cell b filled with the calcium sensitive dye fluo-3, which shows the bipolar cellular morphology more clearly than in the pseudocolor image.
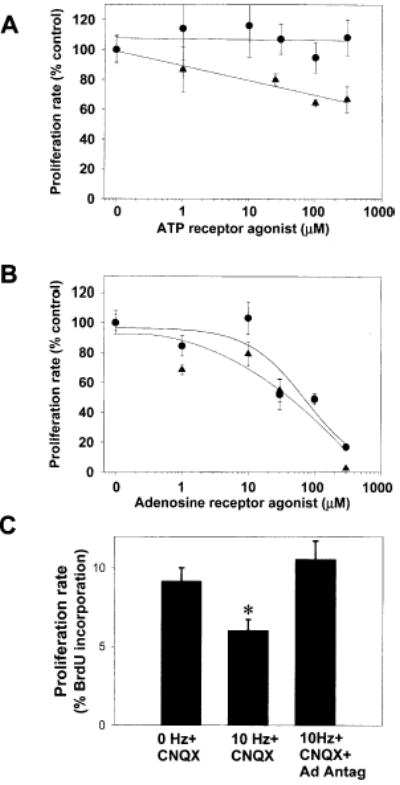
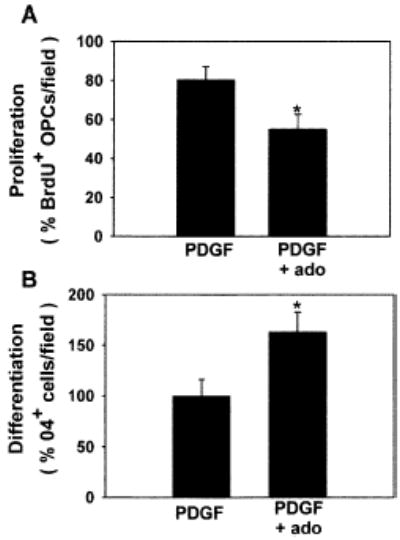
(A) Treatment of OPCs with PDGF+ATP (1–300 μM) for 24 hr resulted in a weak, concentration-dependent inhibition of OPC proliferation (triangles) (p < 0.0001, ANOVA, n = 15 cultures); however, the nonhydrolyzable P2 agonist 2MeS-ATP had no effect (circles) (B) Adenosine (circles), which can be generated by the breakdown of extracellular ATP, strongly inhibited OPC proliferation in a concentration-dependent manner (p < 0.001; ANOVA; n = 68 cultures). This inhibition was mimicked by the adenosine receptor agonist NECA (triangles) (p < 0.0001; ANOVA; n = 23 cultures) (C) Electrical stimulation of DRG axons (10 Hz for 24 hr) inhibited the proliferation rate of cocultured OPCs as determined by BrdU incorporation assay (p < 0.005, n = 18 cultures). The activity-dependent inhibition of OPC proliferation occurred in the presence of the non-NMDA glutamate receptor antagonist CNQX (20 μM), but it was blocked when all major adenosine receptor subtypes were inhibited with a combination of adenosine receptor antagonists DPCPX (200 μM) and MRS-1191 (10 μM) (*p < 0.006, ANOVA; n = 27 cultures).
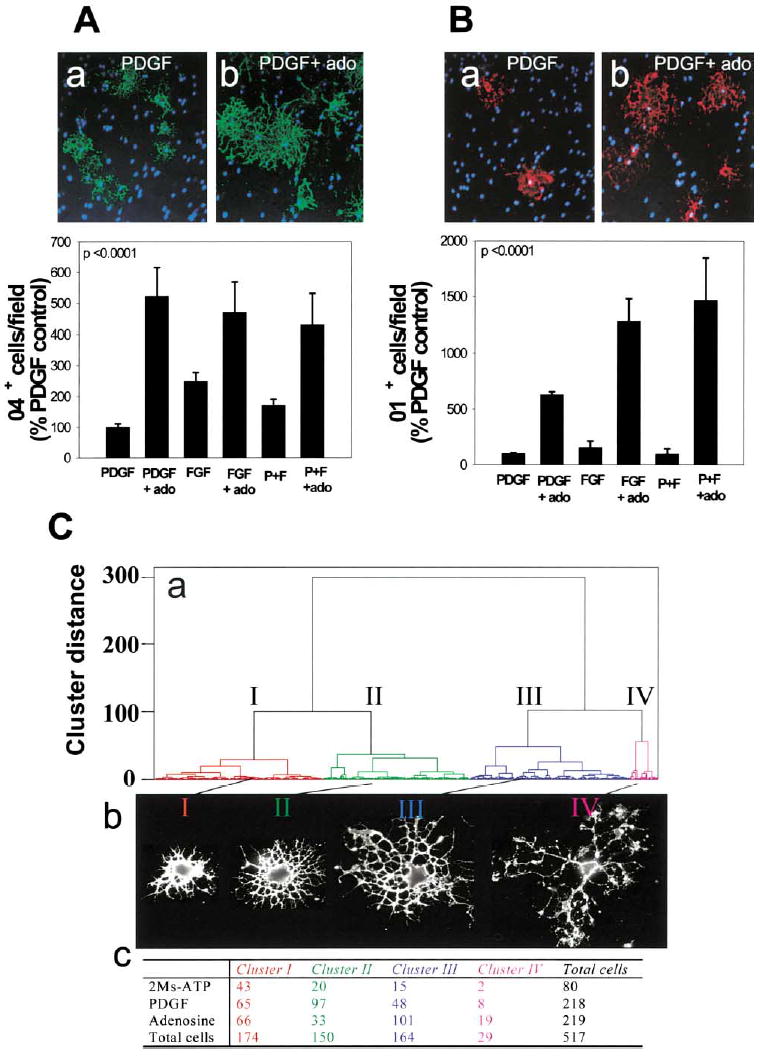
(A) Staining for the O4 antigen (green) in PDGF-treated cultures (a) or after treatment with adenosine (ado) (b) showed a larger proportion of OPCs differentiated to the O4+ stage 48 hr after adenosine treatment (p < 0.0001, t test, n = 12 cultures), regardless of the type of growth factor (PDGF, FGF, or PDGF + FGF) (p < 0.0001, 2-way ANOVA, n = 36 cultures, 39,200 cells) (B) Adenosine treatment (72 hr) also significantly increased the percentage of oligodendrocytes that expressed the O1 antigen (red), a marker of a more mature premyelinating oligodendrocyte (b), compared with PDGF-treated controls (a) (p < 0.0001; 2-way ANOVA; n = 24 cultures; 21,550 cells). Hoechst dye was used as a counterstain to reveal OPC nuclei (blue). (C) A quantitative morphometric multivariate cluster analysis was used to compare differences in morphology of OPCs treated with 2MeS-ATP or adenosine for 48 hr. (a) The dendrogram reveals that OPCs could be classified into four morphological clusters (I–IV) with representative examples shown in (b) and the number of cells in each category following treatment tabulated in (c). Adenosine treatment caused a significant decrease in proportion of cells in cluster II and an increase in cells in clusters III and IV. These morphological changes are indicative of lineage progression to a more mature stage of oligodendrocyte development after adenosine treatment.
In cerebellar slice culture, adenosine receptor activation inhibited proliferation of LB1+ or NG2+ OPCs (A) and stimulated differentiation (B), consistent with results in cell culture. *p < 0.03, n = 11 and n = 15 slices in (A) and (B), respectively.
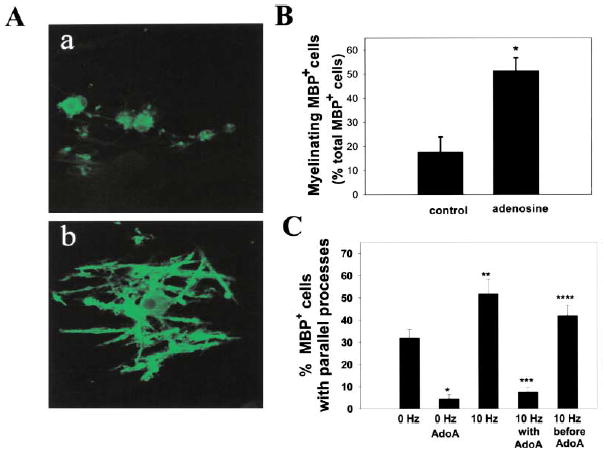
(A) Immunocytochemical staining for MBP was used to compare the effects of chronic adenosine treatment on myelination after 14 days in coculture. In contrast to control cultures (a), OPCs in adenosine-treated cultures displayed multiple parallel processes enriched in MBP (green) and undergoing early stages of myelin formation (b). (B) The number of MBP+ oligodendrocytes with multiple parallel processes in adenosine-treated cultures increased 292% as compared with controls (p < 0.004, t test, n = 14 cultures). Data shown are normalized with respect to the total number of MBP+ cells/field. Similar results were obtained when expressed as the percentage of total OPCs/field (426% increase with adenosine treatment; 7.8% ± 1.3% versus 1.8% ± 0.69%; p < 0.004, n = 14). (C) Cocultures treated with adenosine receptor antagonists (AdoA) (5 μM MRS 1191, 500 nM ZM241385, and 10 μM DPCPX) developed significantly fewer MPB+ oligodendrocytes with multiple parallel processes after 3–4 days in coculture (p < 0.0001, n = 26 cultures). Electrical stimulation for 24 hr (10 Hz) increased the number of MBP+ oligodendrocytes with multiple parallel processes as compared with controls (0 Hz) after 3–4 days in coculture (p < 0.01; n = 28), and this effect was blocked by stimulation in the presence of adenosine receptor antagonists (10 Hz with AdoA) (p < 0.00001, n = 31). Adding the antagonists after the 24 hr stimulus (10 Hz before AdoA) resulted in significantly more MBP+ cells with multiple parallel processes than when the antagonists were added during the stimulus (10 Hz with AdoA) (p < 0.0001, n = 27 cultures), indicating an effect of the antagonist in antagonizing an activity-dependent axon-derived signal. All conditions contained the non-NMDA glutamate receptor antagonist CNQX (20 μM), thus excluding the possible involvement of these glutamate receptors. Similar results were obtained in the absence of CNQX (see Results). *p < 0.0001 versus 0 Hz; **p < 0.01 versus 0 Hz; ***p < 0.00001 versus 10 Hz; ****p < 0.0001 versus AdoA.
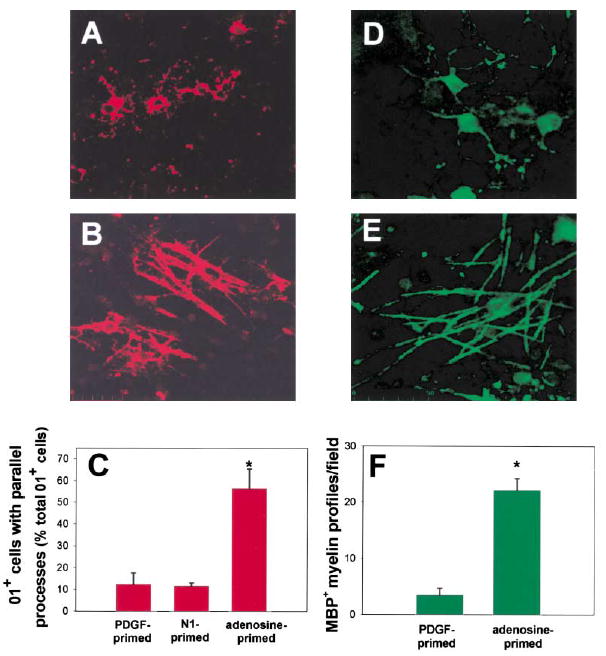
Brief exposure to adenosine was sufficient to promote OPC differentiation and alignment with axons. OPCs were primed by a 48 hr exposure to adenosine, replated onto 3-week-old DRG cultures, and stained for O1. In marked contrast to controls (A), adenosine-primed OPCs expressing the O1 antigen (red) formed multiple parallel processes that were closely associated with axons after only 1 day in co-culture (B). The proportion of O1+ cells with multiple parallel processes increased 402% in cocultures prepared with adenosine-primed OPCs as compared with cocultures of OPCs primed with PDGF or N1, a culture condition known to promote OPC differentiation and increase O1 expression (C) (p < 0.0001; ANOVA, n = 18 cultures). Data shown are normalized to the total number of O1+ cells/field. Similar results were obtained when expressed as the percentage of total OPCs/field (3.5% ± 0.37% versus 0.33% ± 0.12%; adenosine versus control, p < 0.000, n = 15). After 10–12 days in coculture, the degree of myelination was compared in control (D) and cocultures prepared with adenosine-primed OPCs (E) using immunocyto-chemical staining for MBP. (F) A 633% increase in the number of MBP+ myelin profiles/field was seen in cocultures made from adenosine primed OPCs, as compared with controls (E) (p < 0.0001, t test, n = 20 cultures). *Significantly different from control.
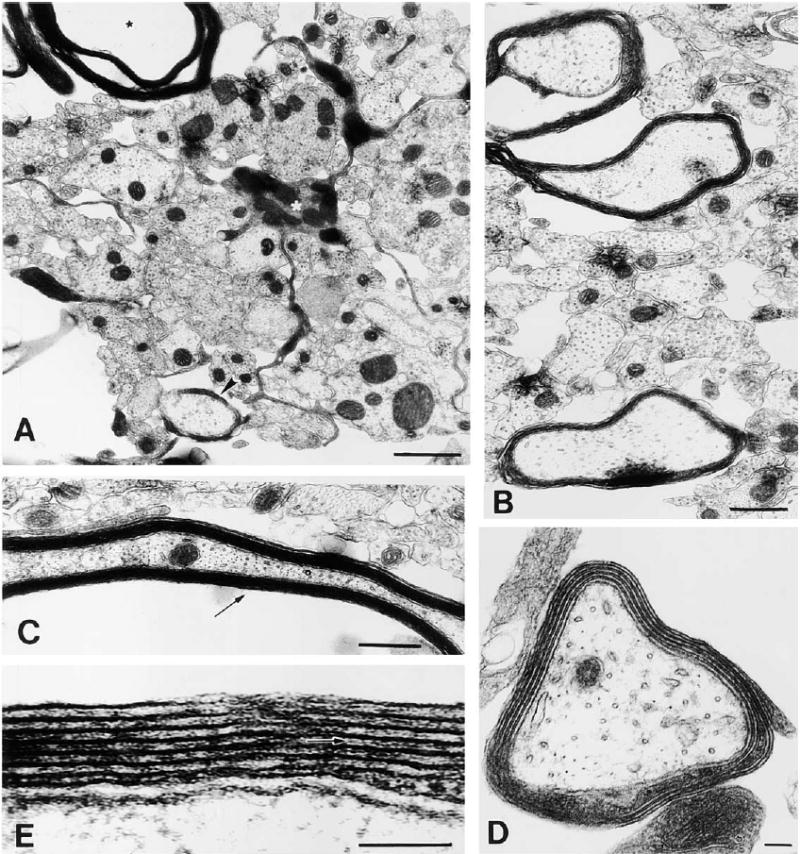
At this stage in culture, oligodendrocytes are actively myelinating large diameter axons. (A) An oligodendrocyte (white asterisk) extending a cellular process between small, unmyelinated axons to ensheath a large-diameter axon (arrowhead), while extending another process forming compact myelin around a different axon (black asterisk). (B) Most large diameter axons are in the process of becoming myelinated. (C) Ultrastructure of compact myelin seen in oblique long section. (D) Higher magnification of an axon undergoing early myelination; four complete wraps of membrane can be seen. (E) A detailed view of the myelin sheath reveals the interperiodal line (arrow) indicative of compact myelin. Scale bars = 1 μm in (A) and (D), 0.5 μm in (B), and 100 nm in (C) and (E).
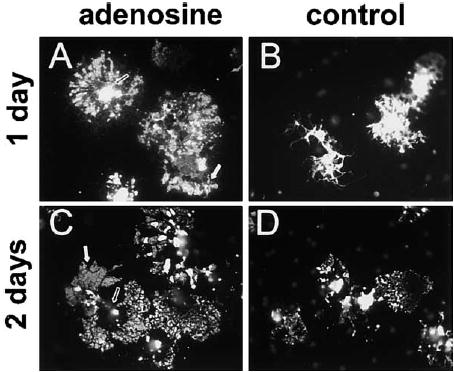
OPCs primed for 48 hr with adenosine (100 μM) or PDGF alone (control) were replated without axons and immunostained for myelin basic protein (MBP) 1 and 2 days later. After 1 day, adenosine-primed OPCs were morphologically distinct from controls ([A] versus [B]). Adenosine-primed OPCs expressed a significantly higher proportion of MBP+ OPCs/field compared with controls (15.2% versus 5.3%; adenosine versus PDGF; n = 4, p < 0.002). After 2 days, the majority of MBP+ oligodendrocytes in adenosine-treated cultures expressed lower levels of MBP in the soma (open arrows, [A] versus [C]) but enhanced expression in large rafts of membrane (white arrows) along their processes as compared to PDGF-primed controls ([C] versus [D]) (11.5% versus 1.15%; adenosine versus PDGF; n = 6, p < 0.003).
References
-
- Barres BA, Raff MC. Proliferation of oligodendrocyte precursor cells depends on electrical activity in axons. Nature. 1993;361:258–260. - PubMed
-
- Barres BA, Lazar MA, Raff MC. A novel role for thyroid hormone, glucocorticoids and retinoic acid in timing oligodendrocyte development. Development. 1994;120:1097–1108. - PubMed
-
- Baumann N, Pham-Dinh D. Biology of oligodendrocyte and myelin in the mammalian central nervous system. Physiol Rev. 2001;81:871–927. - PubMed
MeSH terms
Substances
Grants and funding
LinkOut - more resources
Full Text Sources
Other Literature Sources
