. 2002 Dec 9;159(5):731-7.
doi: 10.1083/jcb.200207076. Epub 2002 Dec 9.

Microtubule release from the centrosome in migrating cells

Affiliations

Microtubule release from the centrosome in migrating cells

Miguel Abal et al. J Cell Biol. .

Abstract

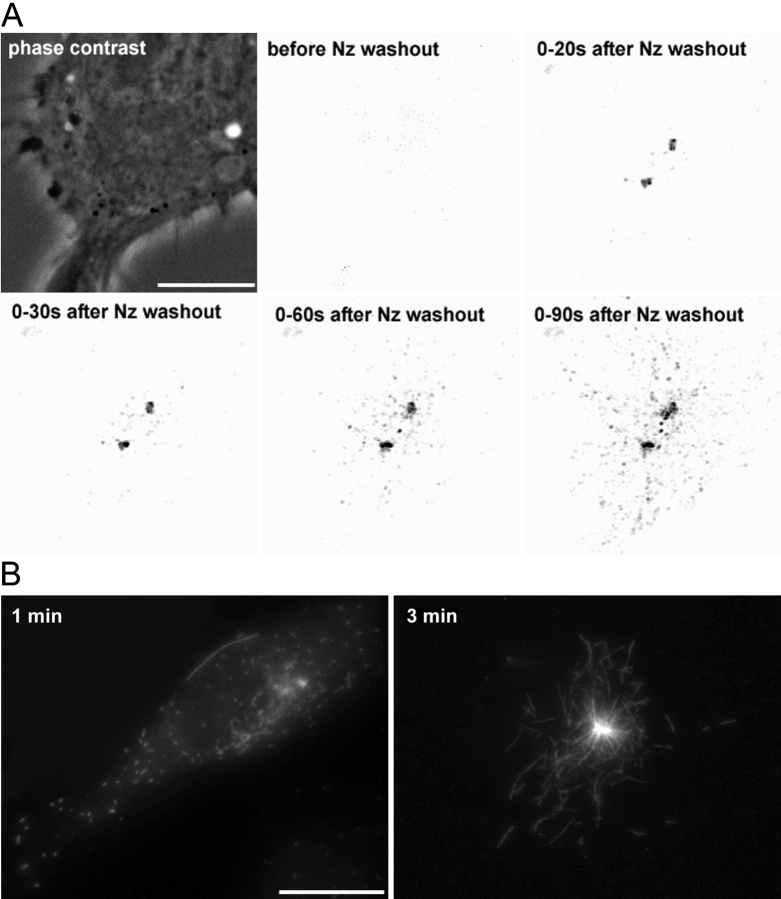
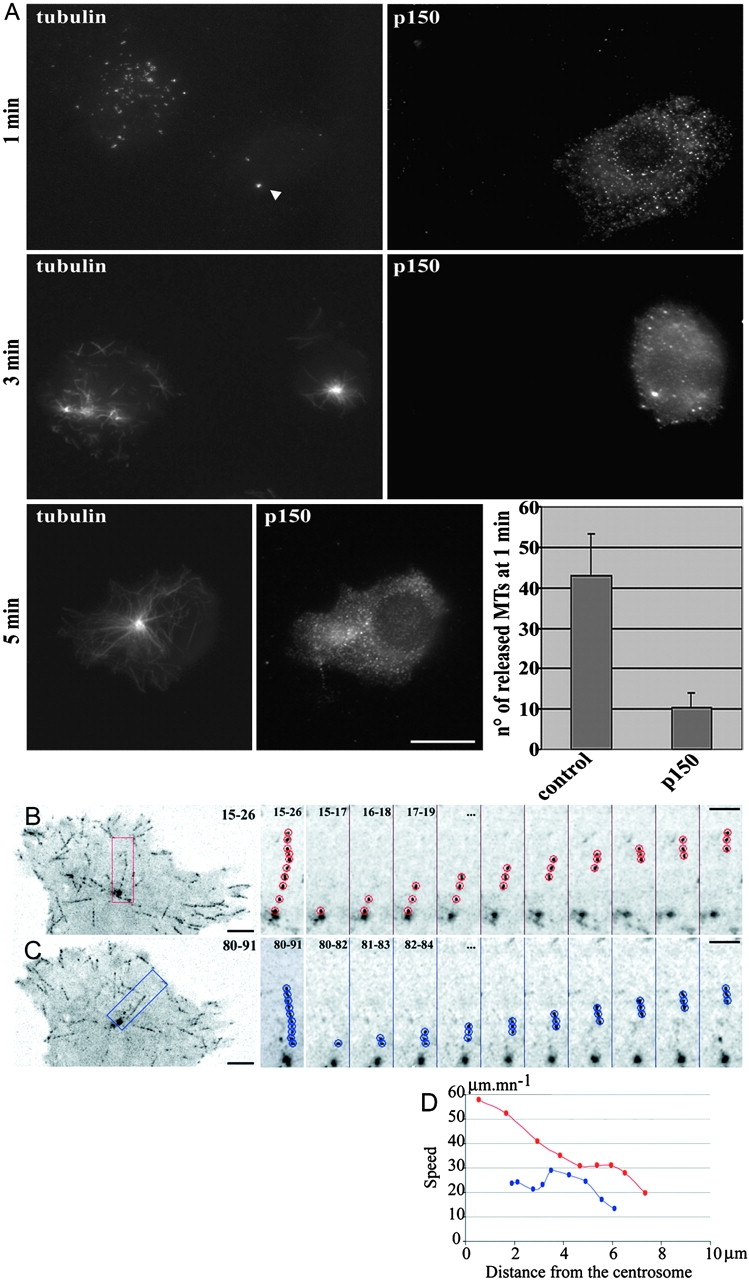
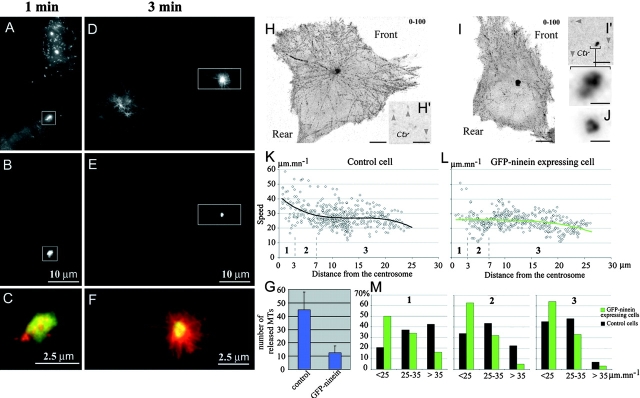
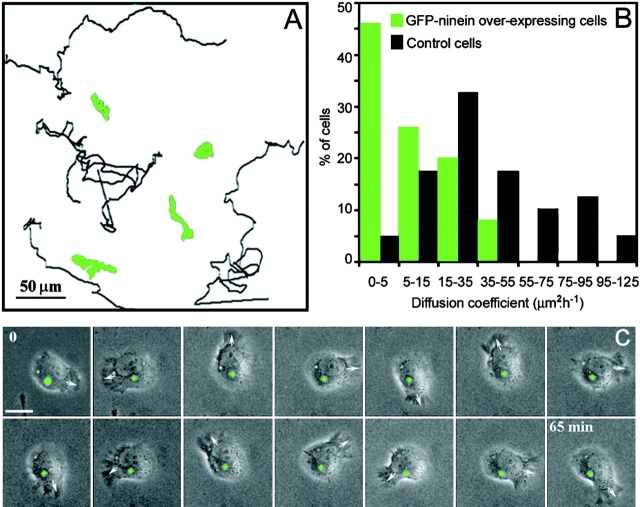
In migrating cells, force production relies essentially on a polarized actomyosin system, whereas the spatial regulation of actomyosin contraction and substrate contact turnover involves a complex cooperation between the microtubule (MT) and the actin filament networks (Goode, B.L., D.G. Drubin, and G. Barnes. 2000. Curr. Opin. Cell Biol., 12:63-71). Targeting and capture of MT plus ends at the cell periphery has been described, but whether or not the minus ends of these MTs are anchored at the centrosome is not known. Here, we show that release of short MTs from the centrosome is frequent in migrating cells and that their transport toward the cell periphery is blocked when dynein activity is impaired. We further show that MT release, but not MT nucleation or polymerization dynamics, is abolished by overexpression of the centrosomal MT-anchoring protein ninein. In addition, a dramatic inhibition of cell migration was observed; but, contrary to cells treated by drugs inhibiting MT dynamics, polarized membrane ruffling activity was not affected in ninein overexpressing cells. We thus propose that the balance between MT minus-end capture and release from the centrosome is critical for efficient cell migration.


Figures

Figure 1.
Figure 1.
Noncentrosomal MTs correspond to released MTs. (A) MTs of L929 cells expressing EB1-GFP were fully depolymerized (2 h at 4°C, 10−6 M nocodazole). Cells were rewarmed in the presence of nocodazole and immediately recorded after nocodazole washout. Images were obtained by stacking consecutive images acquired every 2 s between indicated times. After deconvolution, images have been processed to extract fluorescence structures (EB1-GFP aggregates) from the background. Note that no EB1-GFP dot is visible in the cytoplasm until 20 s after nocodazole washout, but EB1-GFP accumulates around the two centrioles that are separated, as is almost always the case after microtubule depolymerization. After ∼20–30 s, dots appear in the centrosomal region and spread throughout the cytoplasm during the next 60 s. Trajectories are mainly radial and emanate from the centrosome. The boundary of the cell can be estimated from the phase–contrast image (top, left). (B) Coverslips processed as in A were fixed 1 and 3 min immediately after recording and labeled with anti–α-tubulin antibodies. 3 min after regrowth, centrosomal and released MTs elongated. Video 1, demonstrating this process, is available at http://www.jcb.org/cgi/content/full/jcb.200207076/DC1. Bars, 10 μm.
Figure 2.
Figure 2.
Released short MTs are transported by dynein-dynactin complex. (A) Inhibition of dynein– dynactin complex by p150 CC1-DsRed expression in L929 cells. Cells were treated as described in the legend to Fig. 1 and were fixed 1, 3, and 5 min after nocodazole washout. Cells were further stained with anti–α-tubulin antibodies, and p150 CC1-DsRed was visualized in the red channel. Note that almost no short MTs can be observed away from the centrosomal region (arrowhead) in the p150 CC1-DsRed–expressing cell. The number of noncentrosomal MTs has been estimated in control cells (n = 12) and in p150 CC1-DsRed–expressing cells (n = 10) (histogram); error bars indicate a 95% confidence interval calculated with Student's coefficient. (B–D) GFP signal in an EB1-GFP– expressing L929 cell. Images were obtained by stacking consecutive images acquired every second between times indicated in the upper right corner. Examples of EB1-GFP aggregates are shown either leaving the centrosome at a constant speed (C) or leaving the centrosome at a higher speed, and then slowing down (B). Sequential images on the right are a twofold blow up of the regions depicted on the left image. The speed of the particles is shown in D, as a function of their distance from the centrosome. Bars: (A and B) 10 μm; (D and E, left) 5 μm; (D and E, right) 3 μm.
Figure 3.
Figure 3.
GFP-ninein overexpression abolishes the release of MTs from the centrosome. (A–G) GFP-ninein–transfected L929 cells were treated as described in the legend to to Fig. 1 and were fixed 1 (A–C) or 3 min (D–F) after drug removal. MTs were decorated with an anti–α-tubulin antibody (A and D), and GFP-ninein was visualized in the GFP channel (B and E). Note that noncentrosomal MTs are observed only in control cells and that nascent MTs are clustered within the ninein mass in GFP-ninein–overexpressing cells (merge in C and F of the outlined areas shown in A–E). The number of noncentrosomal MTs has been estimated in control cells (n = 12) and GFP-ninein–expressing cells (n = 10) (G). (H–M) EB1-GFP dynamics in control and in GFP-ninein–overexpressing cells. (H and H′) GFP signal in an EB1-GFP– expressing L929 cell; (I and I′) GFP signal in a L929 cell coexpressing EB1-GFP and GFP-ninein. Images were obtained as described in the legend to Fig. 2. Images in H′ and I′ are a detail of the centrosomal region of the cells shown in H and I at time 0, to show the actual staining of the centrosome without any stacking. The arrowheads indicate dots corresponding to EB1-GFP aggregates. Note, in H and I, the increased concentration of EB1-GFP dots in the lamellipodial regions at the front of both the control and the GFP-ninein–expressing cell. Only moderately overexpressing cells were considered for analysis: the sixfold blow-up of the centrosomal area of the GFP-ninein–overexpressing cell at the bottom of I′ is to compare with endogenous ninein in a control cell using an antibody, shown in J. (K and L) Speed of the EB1-GFP aggregates, tracked in the cells shown in H and I as a function of their distance from the centrosome. A polynomial fit has been added. Note the decrease of the mean speed in the first 10 μm around the centrosome in the control cell; whereas, in the GFP-ninein–expressing cell, the curve remains almost flat around 25 μm/min−1. Three regions (1–3) have been distinguished around the centrosome, to make statistics over several cells. There are fewer points in region 1 or 2 than in region 3, because region 3 is where MT rescues are mainly observed, and because of a geometric effect (the surface increases with the square of the radius). (M) For both control condition and GFP-ninein overexpression, statistics were compiled from ∼2,000 EB1-GFP dots, corresponding to ∼200 MTs in 5 different cells. Note that the repartition of speeds in the GFP-ninein–overexpressing cells does not vary with the distance from the centrosome, whereas in control cells, an important population of transported MTs exist in the regions close to the centrosome (1 and 2). Video 2, corresponding to this figure, is available at http://www.jcb.org/cgi/content/full/jcb.200207076/DC1. Bars: (H, H', I, and I') 5 μm; (I' blow-up and J) 1 μm.
Figure 4.
Figure 4.
Ninein accumulation at the centrosome inhibits cell migration. (A) Representative examples of migration trajectories of GFP-ninein–expressing (green tracks) and –nonexpressing L929 cells (black tracks). (B) Histogram showing the distribution of the random migration values for control and GFP-ninein– overexpressing cells. Cell trajectories were characterized by the area covered by cell locomotion in a given time. Note the dramatic inhibition of random migration in GFP-ninein–overexpressing cells. (C) Time-lapse video recording of a GFP-ninein–transfected cell. The first picture is a superimposition of the fluorescence (green) and phase–contrast images; the centrosomal GFP-ninein accumulation is marked by a green cross in all other frames. Note that the centrosome remained almost completely static during the whole sequence, whereas the leading edge (arrow) rotated continuously. See also Video 3; Other cells could show a back and forth movement (Video 4). Videos are available at http://www.jcb.org/cgi/content/full/jcb.200207076/DC1. Bar: 10 μm.

Similar articles

Cited by

References

    1. Ahmad, F.J., W. Yu, F.J. McNally, and P.W. Baas. 1999. An essential role for katanin in severing microtubules in the neuron. J. Cell Biol. 145:305–315. - PMC - PubMed
    1. Ballestrem, C., B. Wehrle-Haller, B. Hinz, and B.A. Imhof. 2000. Actin-dependent lamellipodia formation and microtubule-dependent tail retraction control-directed cell migration. Mol. Biol. Cell. 11:2999–3012. - PMC - PubMed
    1. Fukata, M., T. Watanabe, J. Noritake, M. Nakagawa, M. Yamaga, S. Kuroda, Y. Mutsuura, A. Iwamatsu, F. Perez, and K. Kaibuchi. 2002. Rac 1 and Cdc 42 capture microtubules through IQGAP1 and CLIP-170. Cell. 109:873–885. - PubMed
    1. Garces, J.A., I.B. Clark, D.I. Meyer, and R.B. Vallee. 1999. Interaction of the p62 subunit of dynactin with Arp1 and the cortical actin cytoskeleton. Curr. Biol. 9:1497–1500. - PubMed
    1. Goode, B.L., D.G. Drubin, and G. Barnes. 2000. Functional cooperation between the microtubule and actin cytoskeletons. Curr. Opin. Cell Biol. 12:63–71. - PubMed

Publication types

MeSH terms