Comparative Study
. 2002 Dec 9;159(5):753-63.
doi: 10.1083/jcb.200207115. Epub 2002 Dec 9.

Gene density and transcription influence the localization of chromatin outside of chromosome territories detectable by FISH

Affiliations
Comparative Study

Gene density and transcription influence the localization of chromatin outside of chromosome territories detectable by FISH

Nicola L Mahy et al. J Cell Biol. .

Abstract

Genes can be transcribed from within chromosome territories; however, the major histocompatibilty complex locus has been reported extending away from chromosome territories, and the incidence of this correlates with transcription from the region. A similar result has been seen for the epidermal differentiation complex region of chromosome 1. These data suggested that chromatin decondensation away from the surface of chromosome territories may result from, and/or may facilitate, transcription of densely packed genes subject to coordinate regulation.To investigate whether localization outside of the visible confines of chromosome territories can also occur for regions that are not coordinately regulated, we have examined the spatial organization of human 11p15.5 and the syntenic region on mouse chromosome 7. This region is gene rich but its genes are not coordinately expressed, rather overall high levels of transcription occur in several cell types. We found that chromatin from 11p15.5 frequently extends away from the chromosome 11 territory. Localization outside of territories was also detected for other regions of high gene density and high levels of transcription. This is shown to be partly dependent on ongoing transcription. We suggest that local gene density and transcription, rather than the activity of individual genes, influences the organization of chromosomes in the nucleus.


Figures
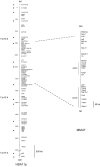
Figure 1.
Figure 1.
Map of HSA11p15 and the region of conserved synteny from MMU7. (Left) Map of the distal 6 Mb of human HSA11p15 from the 11p telomere (tel) encompassing 11p15.5 and 11p15.4 and extending down to 11p15.3, showing the relative position of genes and loci used in this study. Genes are indicated in italics. Asterisks indicate the positions of loci used in this study. (Right) Map of the region of MMU7 in conserved synteny to the BWS-associated region of human 11p15. Gene locations were taken from NCBI online sequencing data (http://www.ncbi.nlm.nih.gov/cgi-bin/Entrez/maps.cgi?org=hum&chr=11), and from published maps (Alders et al., 1997; Hu et al., 1997; Reid et al., 1997; Buettner et al., 1998; Bepler et al., 1999; Kato et al., 1999; Lee et al., 1999; Engemann et al., 2000; Onyango et al., 2000; Paulsen et al., 2000).
Figure 2.
Figure 2.
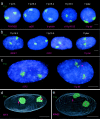
Visualizing the spatial organization of 11p15 relative to the 11p chromosome territory. FISH of selected probes from 11p15.3, 11p15.4, or 11p15.5 (red) together with an HSA11p paint (green) to MAA-fixed lymphoblast (a) or primary fibroblast (b) nuclei. Known genes are italicized. (c) Maximal intensity projection of image stacks after three-dimensional FISH with probes from 11p15.5 (red) and a paint for 11p (green) on pFa-fixed fibroblast nuclei. Cells were counterstained with DAPI (blue). (d and e) Views of MAPaint reconstructions of pFa fixed fibroblast nuclei after three-dimensional FISH with probes (red) for IGF2 (d) and 80N22 (e) together with paints (green) for 11p (d) and 11q (e). Bars, 5 μm.
Figure 3.
Figure 3.
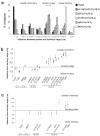
Quantifying the spatial organization of 11p15. (a) Histogram showing the distribution of signals from 11p15 probes relative to the 11p territory edge (μm) after FISH to MAA fixed lymphoblast nuclei. An 11p13 probe is shown for comparison. Negative distances indicate probe signals located beyond the visible limits of the detectable chromosome territory. The localization of cI-11p15–25 is significantly different from that of cq26 (P < 0.000). (b) Mean distance (±95% confidence interval/CI) of 11p15 probes from the edge of the 11p territory of MAA-fixed lymphoblast (•) and fibroblast (▴) nuclei. The number of territories analyzed (n) =100. The mean position of a probe for the PAX6 gene in 11p13 (Mahy et al., 2002) and the chromosome 11 centromere (11pcen) are shown for comparison. cI-11p15.25 and cI-11p15–46 have the same location outside of the 11p territory (P = 0.43); however, cI-11p15–25 is significantly more distant from the territory than cq26 (P < 0.000). (c) Mean distance (±95% CI) in μm of probes from the edge of the 11p territory of pFa-fixed fibroblast nuclei (n ≥ 35).
Figure 4.
Figure 4.
Correlation between gene density and localization relative to chromosome territories. Mean probe positions (normalized for territory radius) relative to the edge of chromosome territories measured in hybridizations to two-dimensional MAA-fixed lymphoblast nuclei, plotted against gene density (Genes/Mb) for all of the regions considered in this analysis. A value of 0 on the y-axis represents the edge of the chromosome territory and negative values indicate that the mean locus position is outside of the chromosome territory. The best-fit line was determined using Microsoft Excel. The equation for the line is y = −0.0242x + 0.315 and r2 = 67%.
Figure 5.
Figure 5.
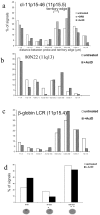
Influence of transcription inhibitors on localization outside of chromosome territories. (a–c) Histograms showing the distribution of signals relative to the 11p (a and c), or 11q (b) territory edge (μm) after FISH with probes cI-11p15–46 in 11p15.5 (a), 80N22 (b), and β-globin (c), to MAA fixed lymphoblast nuclei from untreated cells (open bars), and from cells treated with DRB (filled bars) or ActD (hatched bars). n ≥ 75. (d) The proportion of territories in untreated cells (open bars), or ActD treated cells with both IGF2 and cI-11p15–25 loci contained within the 11p territory (in–in), both loci outside of the territory (out–out), or with one locus in and one locus out.
Figure 6.
Figure 6.
Conservation of intranuclear organization in mouse cells. FISH of BACs (red) and MMU2 and 7chromosome paints (green) hybridized to MAA-fixed ES cell nuclei and counterstained with DAPI. Murine Rcn is in conserved synteny with human 11p13. (Mahy et al., 2002). BAC 245N5 contains the genes from Obph1 to Tssc5 in conserved synteny with human 11p15.5 (Fig. 1). Bar, 5 μm.

References

    1. Abranches, R., A.F. Beven, L. Aragon-Alcaide, and P.J. Shaw. 1998. Transcription sites are not correlated with chromosome territories in wheat nuclei. J. Cell Biol. 143:5–12. - PMC - PubMed
    1. Alders, M., M. Hodges, A.K. Hadjantonakis, J. Postmus, I. van Wijk, J. Bliek, M. de Meulemeester, A. Westerveld, F. Guillemot, C. Oudejans, P. Little, M. Mannens. 1997. The human Achaete-Scute homologue 2 (ASCL2,HASH2) maps to chromosome 11p15.5, close to IGF2 and is expressed in extravillus trophoblasts. Hum. Mol. Genet. 6:859–867. - PubMed
    1. Bepler, G., K.C. O'Briant, Y.C. Kim, G. Schreiber, and D.M. Pitterle. 1999. A 1.4-Mb high-resolution physical map and contig of chromosome segment 11p15.5 and genes in the LOH11A metastasis suppressor region. Genomics. 55:164–175. - PubMed
    1. Boyle, S., S. Gilchrist, J.M. Bridger, N.L. Mahy, J.A. Ellis, and W.A. Bickmore. 2001. The spatial organization of human chromosomes in the nuclei of normal and emerin-mutant cells. Hum. Mol. Genet. 10:211–219. - PubMed
    1. Brown, K.E., S. Amoils, J.M. Horn, V.J. Buckle, D.R. Higgs, M. Merkenschlager, and A.G. Fisher. 2001. Expression of alpha- and beta-globin genes occurs within different nuclear domains in haemopoietic cells. Nat. Cell Biol. 3:602–606. - PubMed

Publication types

MeSH terms