. 2002 Dec;1(6):847-55.
doi: 10.1128/EC.1.6.847-855.2002.

Cellulose synthase (CesA) genes in the green alga Mesotaenium caldariorum

Affiliations

Cellulose synthase (CesA) genes in the green alga Mesotaenium caldariorum

Alison W Roberts et al. Eukaryot Cell. 2002 Dec.

Abstract

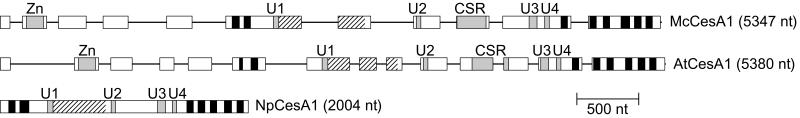
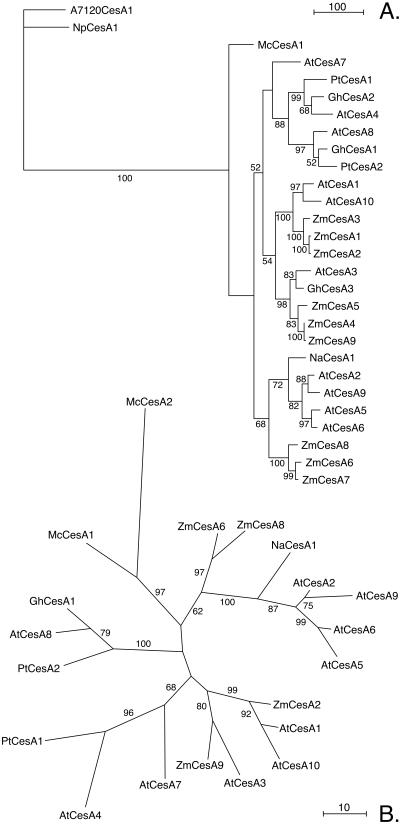
Cellulose, a microfibrillar polysaccharide consisting of bundles of beta-1,4-glucan chains, is a major component of plant and most algal cell walls and is also synthesized by some prokaryotes. Seed plants and bacteria differ in the structures of their membrane terminal complexes that make cellulose and, in turn, control the dimensions of the microfibrils produced. They also differ in the domain structures of their CesA gene products (the catalytic subunit of cellulose synthase), which have been localized to terminal complexes and appear to help maintain terminal complex structure. Terminal complex structures in algae range from rosettes (plant-like) to linear forms (bacterium-like). Thus, algal CesA genes may reveal domains that control terminal complex assembly and microfibril structure. The CesA genes from the alga Mesotaenium caldariorum, a member of the order Zygnematales, which have rosette terminal complexes, are remarkably similar to seed plant CesAs, with deduced amino acid sequence identities of up to 59%. In addition to the putative transmembrane helices and the D-D-D-QXXRW motif shared by all known CesA gene products, M. caldariorum and seed plant CesAs share a region conserved among plants, an N-terminal zinc-binding domain, and a variable or class-specific region. This indicates that the domains that characterize seed plant CesAs arose prior to the evolution of land plants and may play a role in maintaining the structures of rosette terminal complexes. The CesA genes identified in M. caldariorum are the first reported for any eukaryotic alga and will provide a basis for analyzing the CesA genes of algae with different types of terminal complexes.


Figures

FIG. 1.
FIG. 1.
Domain structure of GhCesA1(GenBank accession number U58283) showing positions of degenerate primers (sequences listed in the box) designed to amplify CesA fragments from M. caldariorum strain 41 (UTEX Algal Culture Collection). Bars indicate the predicted products along with their sizes in base pairs. The zinc-binding domain (Zn), putative TMH, U domains, CR-P, and hypervariable region (HVR, also know as the CSR) are labeled.
FIG. 2.
FIG. 2.
PCR amplification of isolated genomic DNA and a genomic DNA library phage suspension from M. caldariorum strain 41 (UTEX Algal Culture Collection) with degenerate primers. Lane 1 shows amplification of a genomic DNA library phage suspension with the primer pair 1F-3R. Lanes 2 to 7 show the results of nested PCR with the products in lane 1 used as the templates with primer pairs 2F-1R, 2F-2R, 1F-1R, 1F-2R, 2F-3R, and 3F-3R, respectively. Lanes 8 to 12 show amplification of isolated genomic DNA with primer pairs 1F-1R, 1F-2R, 1F-3R, 3F-3R, and 2F-3R. The major bands in lanes 2, 7, and 12 were purified and cloned.
FIG. 3.
FIG. 3.
Nucleotide sequence alignment of CesA gene fragments Mc1 and Mc2 amplified from M. caldariorum strain 41 (UTEX Algal Culture Collection) genomic DNA. Nucleotides corresponding to the primers used for amplification are highlighted in gray, intron-exon boundaries predicted by NetGene2 (18) are underlined, and predicted introns are shown in lowercase letters. Deduced amino acid sequences corresponding to both fragments are shown in alignment with the amino acid sequence deduced from a GhCesA1 cDNA sequence. Putative catalytic domains U1 and U2 are highlighted in black. Asterisks indicate identity; colons and periods indicate full conservation of strong and weak groups, respectively (43).
FIG.4.
FIG.4.
Full-length deduced amino acid sequence of M. caldariorum strain 41 (UTEX Algal Culture Collection) CesA1 (GenBank accession number AF525360) aligned with deduced amino acid sequences of CesAs from maize (ZmCesA7 [AF200531]), tobacco (Nicotiana tabacum CesA1 [NaCesA1] [AF304374]), Arabidopsis thaliana (AtCesA1 [AF027172], AtCesA3 [AB018111]) and cotton (GhCesA1 [U58283]). McCesA1 was deduced from a full-length nucleotide sequence isolated from a genomic library. The cDNA sequence was deduced with GenScanW (9). Intron insertion sites are underlined for McCesA1 and angiosperm sequences for which the genomic sequence is known. Domains are indicated below the sequences as follows: the zinc-binding domain with an unshaded box, putative TMH with light gray shading without a box, U domains with a black background, the CR-P with light gray shading within a box, and the variable region or CSR with dark gray shading without a box. Intron insertion sites are underlined in sequences for which they are known. Shaded amino acids indicate sites at which the sequences were edited when alignments for phylogenetic analysis were constructed. Asterisks indicate identical residues; colons and periods indicate full conservation of strong and weak groups, respectively (43).
FIG. 5.
FIG. 5.
Gene structure of McCesA1 (GenBank accession number AF525360), AtCesA1(AF027172), and Nostoc punctiforme CesA1 (NpCesA1) (contig 499). Boxes represent exons and lines represent introns. Putative TMH as predicted by HMMTOP (45) are shown in solid black, the CR-P is shown with diagonal hatching, and other domains are labeled.
FIG. 6.
FIG. 6.
Parsimony phylograms corresponding to the majority consensus trees from 1,000 bootstrap replicates. Bootstrap values are indicated in parentheses. (A) Phylogram rooted with cyanobacterial CesA sequences; (B) unrooted phylogram constructed with CesA fragments corresponding to the Mc2 PCR product. Scale bars indicate the number of changes. NpCesA1, Nostoc punctiforme CesA1; PtCesA1, Populus tremuloides CesA1; NtCesA1, Nicotiana tabacum CesA1.

References

    1. Altschul, S. F., W. Gish, W. Miller, E. W. Myers, and D. J. Lipman. 1990. Basic local alignment search tool. J. Mol. Biol. 215:403-410. - PubMed
    1. Arioli, T., L. Peng, A. S. Betzner, J. Burn, W. Wittke, W. Herth, C. Camilleri, H. Hofte, J. Plazinski, R. Birch, A. Cork, J. Glover, J. Redmond, and R. E. Williamson. 1998. Molecular analysis of cellulose biosynthesis in Arabidopsis. Science 279:717-720. - PubMed
    1. Blanton, R. L., D. Fuller, N. Iranfar, M. J. Grimson, and W. F. Loomis. 2000. The cellulose synthase gene of Dictyostelium. Proc. Natl. Acad. Sci. USA 97:2391-2396. - PMC - PubMed
    1. Brett, C. T. 2000. Cellulose microfibrils in plants: biosynthesis, deposition, and integration into the cell wall. Int. Rev. Cytol. 199:161-199. - PubMed
    1. Brown, R. M., Jr. 1985. Cellulose microfibril assembly and orientation: recent developments. J. Cell Sci. Suppl. 2:13-32. - PubMed

Publication types

MeSH terms

LinkOut - more resources