. 2003 Jan;77(1):84-96.
doi: 10.1128/jvi.77.1.84-96.2003.

Sequences downstream of the 5' splice donor site are required for both packaging and dimerization of human immunodeficiency virus type 1 RNA

Affiliations

Sequences downstream of the 5' splice donor site are required for both packaging and dimerization of human immunodeficiency virus type 1 RNA

Rodney S Russell et al. J Virol. 2003 Jan.

Erratum in

  • J Virol. 2003 Mar;77(6):3891.

Abstract

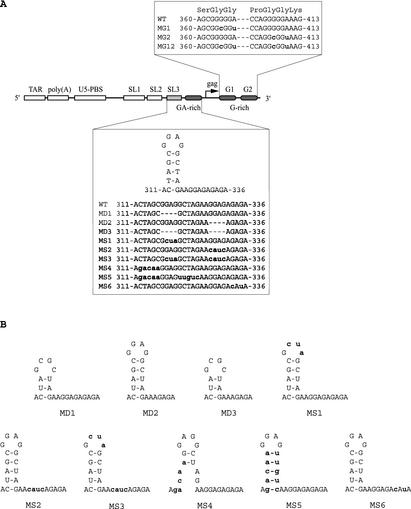
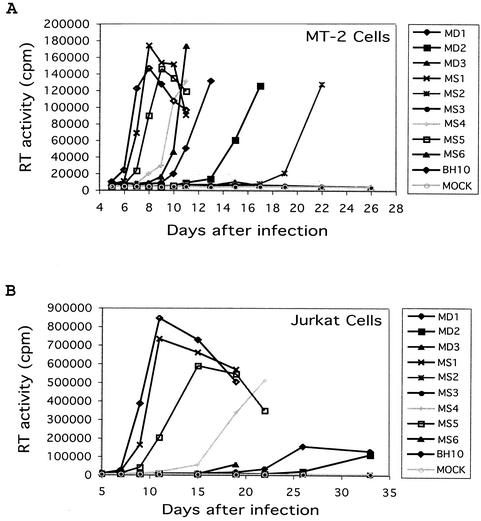
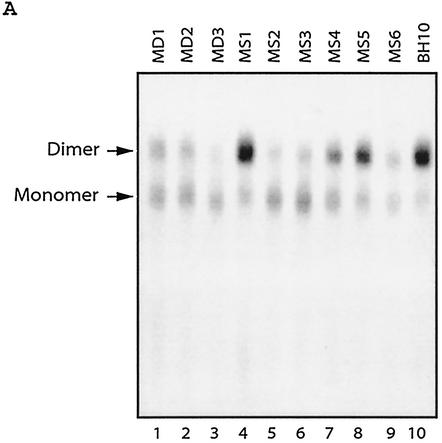
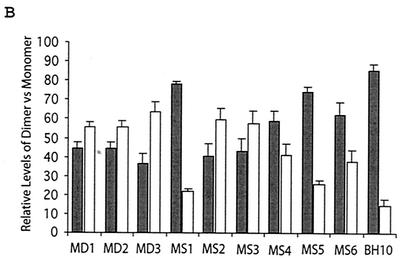
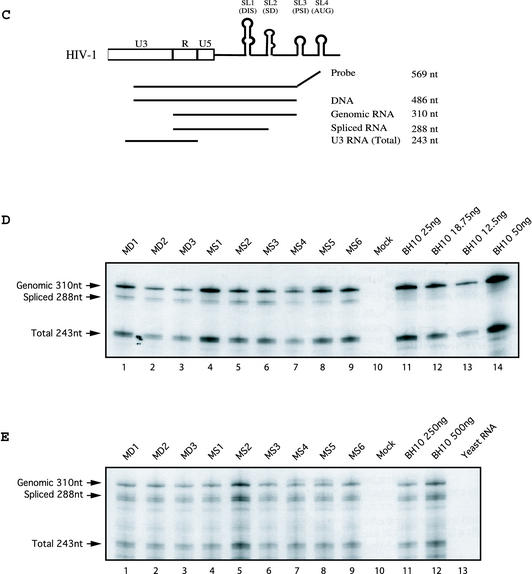
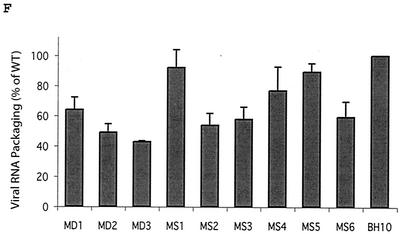
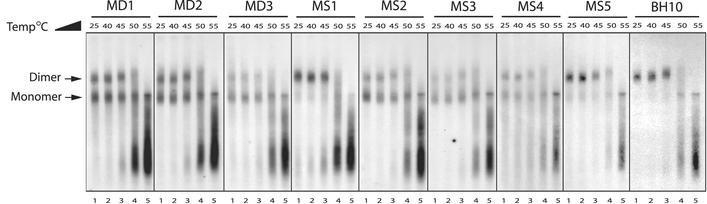
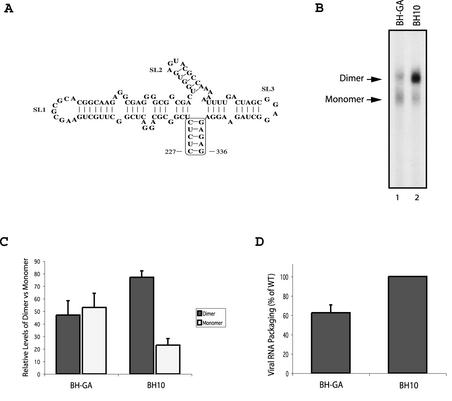
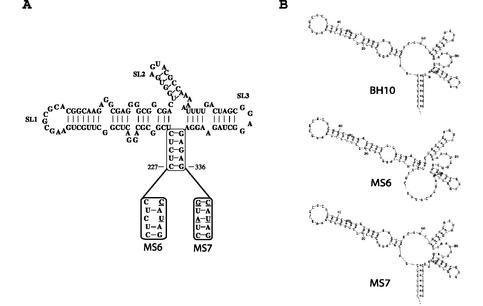
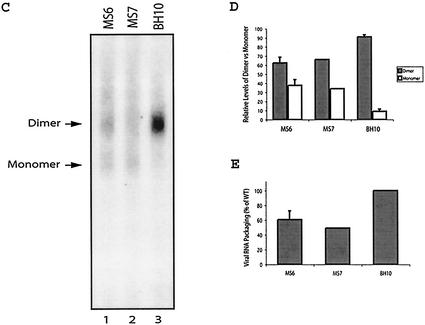
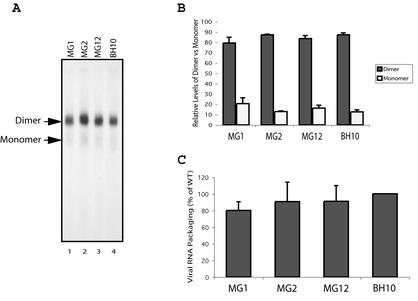
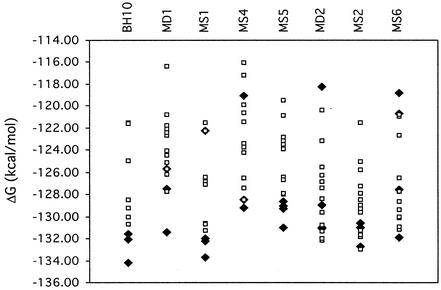
Two copies of human immunodeficiency virus type 1 RNA are incorporated into each virus particle and are further converted to a stable dimer as the virus particle matures. Several RNA segments that flank the 5' splice donor site at nucleotide (nt) 289 have been shown to act as packaging signals. Among these, RNA stem-loop 1 (SL1) (nt 243 to 277) can trigger RNA dimerization through a "kissing-loop" mechanism and thus is termed the dimerization initiation site. However, it is unknown whether other packaging signals are also needed for dimerization. To pursue this subject, we mutated stem-loop 3 (SL3) (nt 312 to 325), a GA-rich region (nt 325 to 336), and two G-rich repeats (nt 363 to 367 and nt 405 to 409) in proviral DNA and assessed the effects on RNA dimerization by performing native Northern blot analyses. Our results show that the structure but not the specific RNA sequence of SL3 is needed not only for efficient viral RNA packaging but also for dimerization. Mutations of the GA-rich sequence severely diminished viral RNA dimerization as well as packaging; the combination of mutations in both SL3 and the GA-rich region led to further decreases, implying independent roles for each of these two RNA motifs. Compensation studies further demonstrated that the RNA-packaging and dimerization activity of the GA-rich sequence may not depend on a putative interaction between this region and a CU repeat sequence at nt 227 to 233. In contrast, substitutions in the two G-rich sequences did not cause any diminution of viral RNA packaging or dimerization. We conclude that both the SL3 motif and GA-rich RNA sequences, located downstream of the 5' splice donor site, are required for efficient RNA packaging and dimerization.


Figures

FIG. 1.
FIG. 1.
Description of mutations generated in HIV-1 RNA sequences downstream of the 5′ major splice donor (SD) site. (A) Mutations MG1, MG2, and MG12 are shown at the top; these altered the G-rich sequences without changing relevant amino acid sequences in MA. Mutations in SL3 and the GA-rich region are diagrammed at the bottom. Deleted nucleotides are indicated by a dash. Nucleotides numbers refer to the first nucleotide of the R region. A number of structural domains in the leader region are shown: these include TAR, poly(A), U5-PBS, SL1, SL2, and SL3. (B) Schematic representation of all mutants listed in A. In MS1, the loop sequence was changed without disrupting the SL3 stem; in MS4, the left portion of the stem sequences was replaced, destabilizing stem base pairing; in MS5, the stem in SL3 was restored by insertion of a compensatory mutation. MD1 represents a deletion of the SL3 loop; MD2 represents a deletion of the GA-rich sequence just adjacent to SL3; MD3 is a combination of the MD1 and MD2 deletions; MS2 contains a substitution of the GA-rich sequence just adjacent to SL3; MS3 carries a combination of the MS1 and MS2 substitutions; MS6 contains substitutions of the two G's at nt 332 and 334. RNA structures were predicted by the M-Fold program (29, 44).
FIG. 2.
FIG. 2.
Infectiousness of mutant viruses MD1 to MD3 and MS1 to MS6 in permissive cell lines. MT-2 cells (A) and Jurkat cells (B) were infected with an amount of progeny virus equal to 5 ng of p24 antigen. Virus growth was monitored by measuring reverse transcriptase activity in culture fluids at various times. Mock infection represents exposure of cells to heat-inactivated wild-type viruses.
FIG. 3.
FIG. 3.
Effects of various mutations on viral RNA dimerization and packaging. (A) Viral RNA was prepared from mutant viruses MD1 to MD3 and MS1 to MS6 (lanes 1 to 9) and wild-type virus BH10 (lane 10), equivalent to 150 ng of p24 antigen, and fractionated on native agarose gels, followed by Northern blot analysis. Dimers and monomers are indicated on the left side of the gels. Results from one representative gel are shown. (B) Band intensities of dimer (solid bars) and monomer (open bars) signals were measured with the NIH Image program, and relative levels for each construct were plotted. The results represent pooled data from three Northern blots with virion-derived RNA from three independent transfections of each mutant. (C) Schematic illustration of the RNase protection assay system used to quantify viral RNA, based on the strategy used by Clever and Parslow (7). Shown are the 5′ long terminal repeat sequences, including U3, R, U5, and stem loops 1 to 4. Below are shown the probe (569 nt) and the protected fragments that would be generated from the various viral RNA and DNA sequences; these include DNA (486 nt); full-length genomic RNA (310 nt; panel D, upper band), spliced RNA (288 nt; panel D, middle band), and 3′ long terminal repeat sequence (243 nt; panel D, lower band), which serves as an internal control for total viral RNA. (D) RNase protection assay performed on virion-derived RNA from mutants MD1 to MD3 and MS1 to MS6 (lanes 1 to 9) and wild-type BH10 (lane 11) viruses. An amount of viral RNA equivalent to 25 ng of p24 capsid antigen was annealed to 105 cpm of radiolabeled riboprobe and digested with RNases specific for single-stranded RNA, and protected fragments were separated by denaturing 5% polyacrylamide gel electrophoresis. Transfection of the pSP72 cloning vector served as a mock experiment (lane 10). A dilution series of wild-type RNA was analyzed to show the linear range of the assay (25, 18.75, and 12.5 ng of p24 in lanes 11 to 13, respectively). Wild-type RNA equivalent to 50 ng of p24 was also analyzed to demonstrate that the assay was not saturated at 25 ng of p24 (lane 14). One representative gel is shown from two independent experiments. (E) RNase protection assay performed on cytoplasmic RNA from transfections of mutants MD1 to MD3 and MS1 to MS6 (lanes 1 to 9) and wild-type BH10 (lane 11) DNA constructs as described for D with 250 ng of RNA. A twofold sample (500 ng) of cytoplasmic RNA from transfection of wild type BH10 was analyzed to demonstrate that the assay was not saturated at 250 ng of RNA (lane 12). A sample containing 10 μg of yeast tRNA was used as a negative control (lane 13). One representative gel is shown from two independent experiments. (F) Packaging levels of mutant viral RNA expressed as a percentage of that of wild-type (WT) virus BH10 (arbitrarily set at 100%). The bar graph represents data pooled from three Northern blots and two RNase protection assay gels with RNA from five independent transfections of each mutant.
FIG. 3.
FIG. 3.
Effects of various mutations on viral RNA dimerization and packaging. (A) Viral RNA was prepared from mutant viruses MD1 to MD3 and MS1 to MS6 (lanes 1 to 9) and wild-type virus BH10 (lane 10), equivalent to 150 ng of p24 antigen, and fractionated on native agarose gels, followed by Northern blot analysis. Dimers and monomers are indicated on the left side of the gels. Results from one representative gel are shown. (B) Band intensities of dimer (solid bars) and monomer (open bars) signals were measured with the NIH Image program, and relative levels for each construct were plotted. The results represent pooled data from three Northern blots with virion-derived RNA from three independent transfections of each mutant. (C) Schematic illustration of the RNase protection assay system used to quantify viral RNA, based on the strategy used by Clever and Parslow (7). Shown are the 5′ long terminal repeat sequences, including U3, R, U5, and stem loops 1 to 4. Below are shown the probe (569 nt) and the protected fragments that would be generated from the various viral RNA and DNA sequences; these include DNA (486 nt); full-length genomic RNA (310 nt; panel D, upper band), spliced RNA (288 nt; panel D, middle band), and 3′ long terminal repeat sequence (243 nt; panel D, lower band), which serves as an internal control for total viral RNA. (D) RNase protection assay performed on virion-derived RNA from mutants MD1 to MD3 and MS1 to MS6 (lanes 1 to 9) and wild-type BH10 (lane 11) viruses. An amount of viral RNA equivalent to 25 ng of p24 capsid antigen was annealed to 105 cpm of radiolabeled riboprobe and digested with RNases specific for single-stranded RNA, and protected fragments were separated by denaturing 5% polyacrylamide gel electrophoresis. Transfection of the pSP72 cloning vector served as a mock experiment (lane 10). A dilution series of wild-type RNA was analyzed to show the linear range of the assay (25, 18.75, and 12.5 ng of p24 in lanes 11 to 13, respectively). Wild-type RNA equivalent to 50 ng of p24 was also analyzed to demonstrate that the assay was not saturated at 25 ng of p24 (lane 14). One representative gel is shown from two independent experiments. (E) RNase protection assay performed on cytoplasmic RNA from transfections of mutants MD1 to MD3 and MS1 to MS6 (lanes 1 to 9) and wild-type BH10 (lane 11) DNA constructs as described for D with 250 ng of RNA. A twofold sample (500 ng) of cytoplasmic RNA from transfection of wild type BH10 was analyzed to demonstrate that the assay was not saturated at 250 ng of RNA (lane 12). A sample containing 10 μg of yeast tRNA was used as a negative control (lane 13). One representative gel is shown from two independent experiments. (F) Packaging levels of mutant viral RNA expressed as a percentage of that of wild-type (WT) virus BH10 (arbitrarily set at 100%). The bar graph represents data pooled from three Northern blots and two RNase protection assay gels with RNA from five independent transfections of each mutant.
FIG. 4.
FIG. 4.
Measurement of RNA dimer stability. Virion-derived RNA was treated at different temperatures before electrophoresis on native agarose gels. Lanes 1 to 5 represent incubations performed at 25°C, 40°C, 45°C, 50°C, and 55°C, respectively.
FIG. 5.
FIG. 5.
Effects of RNA concentration on viral RNA dimerization. (A) A series of RNA samples of the MD1 mutant containing 300, 200, 100, and 50 ng of p24 equivalent (lanes 1 to 4) and wild-type BH10 (lanes 5 to 8) virus RNA were analyzed by native Northern blotting. Dimers and monomers are indicated on the left side of the gels. (B) Band intensities of dimer and monomer signals were measured with the NIH Image program, and relative levels for each lane were plotted.
FIG. 6.
FIG. 6.
Mutation of CU repeat RNA sequence (nt 227 to 233) affects viral RNA dimerization and packaging. (A) Illustration of a structural domain formed by viral RNA sequences from nt 227 to 335. This domain contains the SL1, SL2, and SL3 RNA motifs and is isolated from other RNA structures by a stem formed by long-range interactions between two stretches of RNA sequences at nt 227 to 231 and nt 332 to 336 (14). In the BH-GA mutation, the RNA stretch at nt 227 to 233 was replaced with the sequence 5′-AGAG-3′, which presumably disrupted the highlighted stem. (B) Native Northern blots of BH-GA (lane 1) and BH10 (lane 2) RNAs derived from an amount of virus particles equivalent to 150 ng of p24 antigen. The intensities of RNA signals were measured with the NIH Image program. Dimers and monomers are indicated on the left side of the gels. Results for one representative gel are shown. (C) Band intensities of dimer and monomer signals were measured with the NIH Image program, and relative levels for each construct were plotted. (D) RNA packaging levels were expressed as a percentage of that of the wild-type (WT) virus BH10 (arbitrarily set at 100%). Results shown in C and D represent pooled data from three Northern blots of three independent transfections of each mutant.
FIG. 7.
FIG. 7.
Analysis of the putative RNA-RNA interactions between the CU repeats (nt 227 to 233) and the GA-rich sequences (nt 325 to 336). (A) Illustration of a structural domain formed by viral RNA sequences from nt 227 to nt 336. Nucleotides changed in MS6 and MS7 are underlined. (B) Secondary-structure models representing the region shown in A for MS6, MS7, and wild-type BH10 based on the M-Fold algorithm (29, 44). (C) Native Northern blots of MS6, MS7, and BH10 (lanes 1 to 3) RNAs derived from an amount of virus particles equivalent to 150 ng of p24 antigen. The intensities of RNA signals were measured with the NIH Image program. Dimers and monomers are indicated on the left side of the gels. Results from one representative gel are shown. (D) Band intensities of dimer and monomer signals were measured with the NIH Image program, and relative levels for each construct were plotted. (E) RNA packaging levels were expressed as a percentage of that of wild-type (WT) virus BH10 (arbitrarily set at 100%). Results shown in D and E represent pooled data from three independent experiments for MS6 and BH10 and two for MS7.
FIG. 7.
FIG. 7.
Analysis of the putative RNA-RNA interactions between the CU repeats (nt 227 to 233) and the GA-rich sequences (nt 325 to 336). (A) Illustration of a structural domain formed by viral RNA sequences from nt 227 to nt 336. Nucleotides changed in MS6 and MS7 are underlined. (B) Secondary-structure models representing the region shown in A for MS6, MS7, and wild-type BH10 based on the M-Fold algorithm (29, 44). (C) Native Northern blots of MS6, MS7, and BH10 (lanes 1 to 3) RNAs derived from an amount of virus particles equivalent to 150 ng of p24 antigen. The intensities of RNA signals were measured with the NIH Image program. Dimers and monomers are indicated on the left side of the gels. Results from one representative gel are shown. (D) Band intensities of dimer and monomer signals were measured with the NIH Image program, and relative levels for each construct were plotted. (E) RNA packaging levels were expressed as a percentage of that of wild-type (WT) virus BH10 (arbitrarily set at 100%). Results shown in D and E represent pooled data from three independent experiments for MS6 and BH10 and two for MS7.
FIG. 8.
FIG. 8.
Effects of MG1, MG2, and MG12 mutations on viral replication as determined by infection of MT-2 cells (A) and Jurkat cells (B). Virus growth was monitored by measurement of reverse transcriptase activity in culture fluids at various times.
FIG. 9.
FIG. 9.
Effects of MG1, MG2, and MG12 mutations on viral RNA dimerization and packaging. (A) Native Northern blot analyses were performed on MG1, MG2, and MG12 (lanes 1 to 3, respectively) and wild-type BH10 (lane 4) RNAs derived from an amount of virus particles equivalent to 150 ng of p24 antigen. The intensities of RNA signals were measured with the NIH Image program. Dimers and monomers are indicated on the left side of the gels. Results from one representative gel are shown. (B) Band intensities of dimer and monomer signals were measured with the NIH Image program, and relative levels for each construct were plotted. (C) RNA packaging levels were expressed as a percentage of that of the wild-type (WT) virus BH10 (arbitrarily set at 100%). Results shown in B and C represent pooled data from three independent experiments.
FIG. 10.
FIG. 10.
Structural analysis of mutated and wild-type HIV-1 RNA sequences spanning nt 1 to 360 on the basis of the M-Fold program (29, 44). Each point in a series represents one possible structural prediction that the program generates. For sequences 300 to 400 nt in length, the program typically generates 12 to 15 possible structures and ranks them based on free-energy (ΔG) calculations. Structures representing each mutation were divided into two groups based on the presence (⧫) or absence (□) of the dimerization initiation site (SL1) motif, and their ΔG values are plotted.

Similar articles

Cited by

References

    1. Aldovini, A., and R. A. Young. 1990. Mutations of RNA and protein sequences involved in human immunodeficiency virus type 1 packaging result in production of noninfectious virus. J. Virol. 64:1920-1926. - PMC - PubMed
    1. Awang, G., and D. Sen. 1993. Mode of dimerization of HIV-1 genomic RNA. Biochemistry 32:11453-11457. - PubMed
    1. Berkhout, B., and J. L. van Wamel. 1996. Role of the dimerization initiation site hairpin in replication of human immunodeficiency virus type 1. J. Virol. 70:6723-6732. - PMC - PubMed
    1. Berkhout, B., and J. L. van Wamel. 2000. The leader of the HIV-1 RNA genome forms a compactly folded tertiary structure. RNA 6:282-295. - PMC - PubMed
    1. Berkowitz, R., J. Fisher, and S. P. Goff. 1996. RNA packaging. Curr. Top. Microbiol. Immunol. 214:177-218. - PubMed

Publication types