

doi: 10.1073/pnas.262658899.
Epub 2002 Dec 11.
An ensemble method for identifying regulatory circuits with special reference to the qa gene cluster of Neurospora crassa
Affiliations
- PMID: 12477937
- PMCID: PMC139242
- DOI: 10.1073/pnas.262658899
Item in Clipboard
An ensemble method for identifying regulatory circuits with special reference to the qa gene cluster of Neurospora crassa
Proc Natl Acad Sci U S A.
.
Abstract
A chemical reaction network for the regulation of the quinic acid (qa) gene cluster of Neurospora crassa is proposed. An efficient Monte Carlo method for walking through the parameter space of possible chemical reaction networks is developed to identify an ensemble of deterministic kinetics models with rate constants consistent with RNA and protein profiling data. This method was successful in identifying a model ensemble fitting available RNA profiling data on the qa gene cluster.
Figures
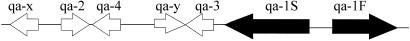
Gene organization in the qa cluster of N. crassa, two regulatory genes, and five structural genes.
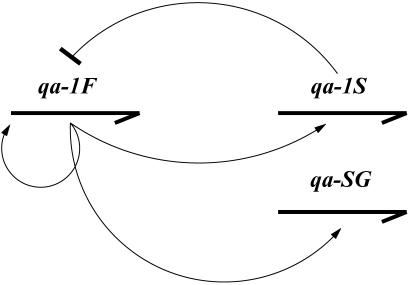
Regulatory gene control. Arrows indicate RNA transcripts controlled by the protein products (thin lines) of the qa-1F activator and the qa-1S repressor. qa-SG is the five structural genes.
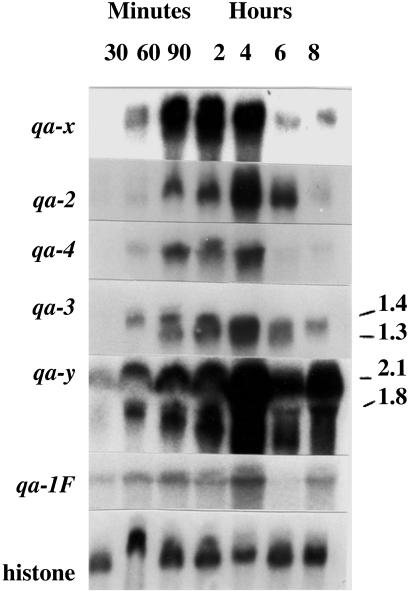
RNA profiles (or Northern blots) for six genes in the qa cluster together with that of the histone (H3) as a control at 30 min, 60 min, 90 min, 2 h, 4 h, 6 h, and 8 h. Sizes of some messages are indicated on the right.
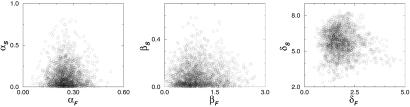
Projections of an MC sample of Θ, drawn from Q(Θ), into three distinct Θ planes.
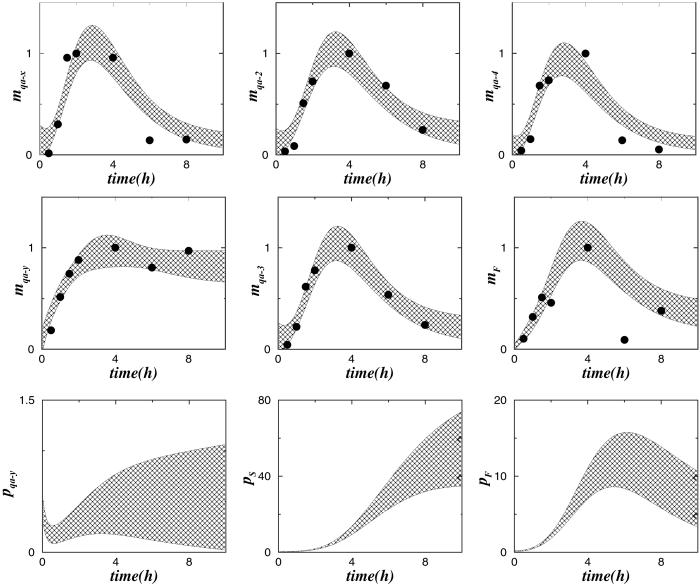
Comparison of experimental and ensemble model dynamics of mRNAs of the qa cluster. The dots are the data derived from Fig. 3. The shadowed areas enclose 4 ensemble standard deviations of mx, for x = F, S, sg, centered around the ensemble mean of mx. Also shown are the corresponding ensemble predictions for several protein levels px.
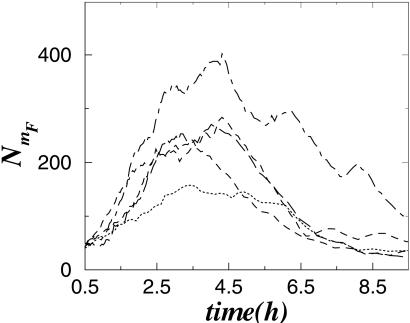
Dynamics of the total number of qa-1F mRNA molecules, obtained by simulations of the stochastic model corresponding to Eq. 1, as described in the text. Different realizations of the stochastic model trajectory generate patterns with maxima located near 4 h in accordance with experimental data in Fig. 3.
References
-
- Venter J. C., Adams, M. D., Myers, E. W., Li, P. W., Mural, R. J., Sutton, G. G., Smith, H. O., Yandell, M., Evans, C. A., Holt, R. A., et al. (2001) Science 291, 1304-1351. - PubMed
-
- International Human Genome Sequencing Consortium (2001) Nature 409, 860-921. - PubMed
-
- DeRisi J. L., Iyer, V. R. & Brown, P. O. (1997) Science 278, 680-686. - PubMed
-
- Gygi S. P., Rist, B., Gerber, S. A., Turecek, F., Gelb, M. H. & Aebersold, R. (1999) Nat. Biotechnol. 17, 994-999. - PubMed
-
- Uetz P. L., Glot, L., Cagney, G., Mansfield, T. A., Judson, R. S., Knight, J. R., Lockshon, D., Narayan, V., Srinivasan, M., Pochart, P., et al. (2000) Nature 403, 623-627. - PubMed
MeSH terms
Substances
LinkOut - more resources
Full Text Sources
