

The genetic origins of the Andaman Islanders
- PMID: 12478481
- PMCID: PMC378623
- DOI: 10.1086/345487
The genetic origins of the Andaman Islanders
Abstract
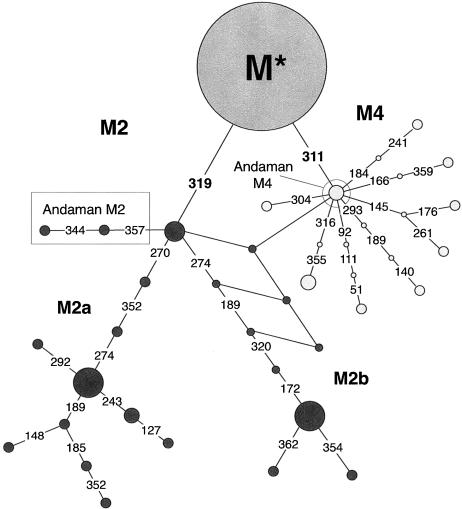
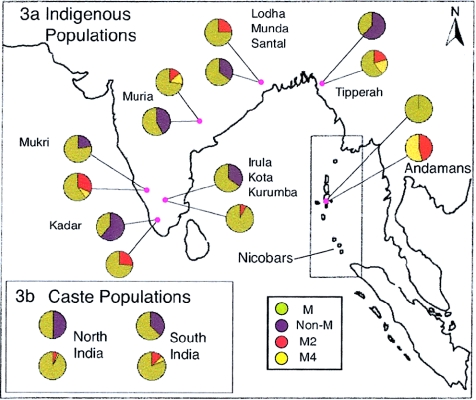
Mitochondrial sequences were retrieved from museum specimens of the enigmatic Andaman Islanders to analyze their evolutionary history. D-loop and protein-coding data reveal that phenotypic similarities with African pygmoid groups are convergent. Genetic and epigenetic data are interpreted as favoring the long-term isolation of the Andamanese, extensive population substructure, and/or two temporally distinct settlements. An early colonization featured populations bearing mtDNA lineage M2, and this lineage is hypothesized to represent the phylogenetic signal of an early southern movement of humans through Asia. The results demonstrate that Victorian anthropological collections can be used to study extinct, or seriously admixed populations, to provide new data about early human origins.
Figures
Comment in
-
South Asia, the Andamanese, and the genetic evidence for an "early" human dispersal out of Africa.Am J Hum Genet. 2003 Jun;72(6):1586-90; author reply 1590-3. doi: 10.1086/375407. Am J Hum Genet. 2003. PMID: 12817589 Free PMC article. No abstract available.
References
Electronic-Database Information
-
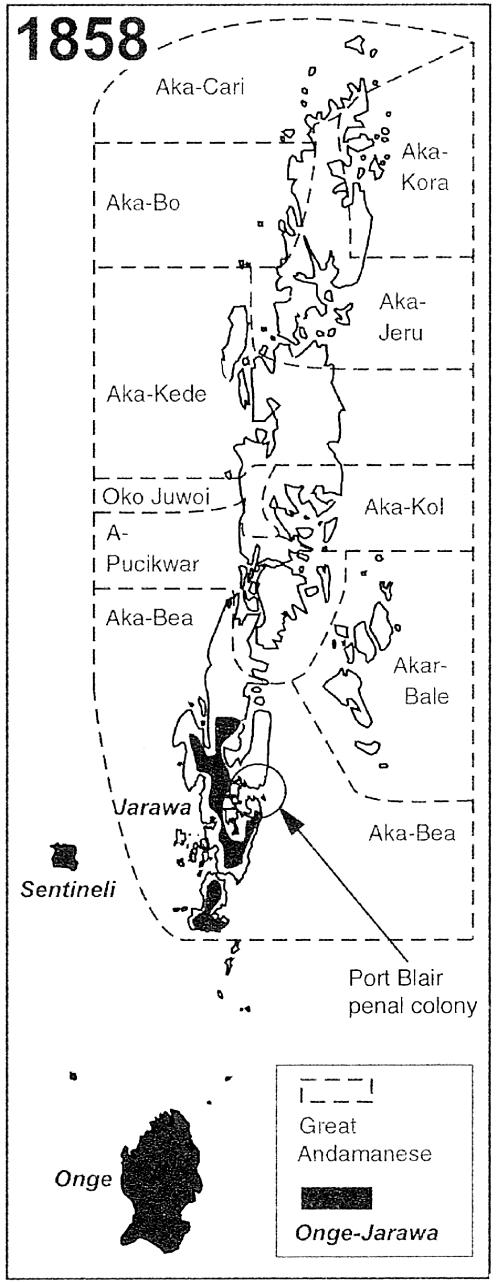
- GenBank, http://www.ncbi.nlm.nih.gov/ (for accession nos. AY191255 [Aka-Bea 3], AY191256 [Aka-Bea 6], AY191257 [Aka-Bea 1], AY191258 [Aka-Bea 2], AY191259 [Aka-Bea 5], AY191260 [Aka-Bea 8], AY191261 [Aka-Bea 4], AY191262 [Aka-Bea 7], AY191263 [Aka-Bea 9], AY191264 [Jarawa 1], AY191265 [Jarawa 2], and AY191266 [Nicobar 1])
References
-
- Anderson S, Bankier AT, Arrel B, de Brujin M, Coulson A, Drouin J, Eperon I, Nierlich D, Roe B, Sanger F, Schreier P, Smith A, Staden R, Young I (1981) Sequence and organisation of the human mitochondrial genome. Nature 290:457–465 - PubMed
-
- Avise J, Arnold J, Ball R, Bermingham E, Lamb T, Neigle J, Reeb C , Saunders NC (1987) Intraspecific phylogeography: the mitochondrial DNA bridge between population genetics and systematics. Ann Rev Ecol Syst 18:489–522
-
- Barnard-Davis J (1867) Thesaurus craniorum: catalogue of the skulls of the various races of man, in the collection of Joseph Barnard-Davis. Printed for the subscribers, London
-
- Cavalli-Sforza L, Menozzi P, Piazza A (1994) The history and geography of human genes. Princeton University Press, Princeton, NJ
Publication types
MeSH terms
Substances
Associated data
- Actions
- Actions
- Actions
- Actions
- Actions
- Actions
- Actions
- Actions
- Actions
- Actions
- Actions
- Actions
Grants and funding
LinkOut - more resources
Full Text Sources
