

A demonstration of the impact of response bias on the results of patient satisfaction surveys
- PMID: 12479503
- PMCID: PMC1464019
- DOI: 10.1111/1475-6773.11194
A demonstration of the impact of response bias on the results of patient satisfaction surveys
Abstract
Objectives: The purposes of the present study were to examine patient satisfaction survey data for evidence of response bias, and to demonstrate, using simulated data, how response bias may impact interpretation of results.
Data sources: Patient satisfaction ratings of primary care providers (family practitioners and general internists) practicing in the context of a group-model health maintenance organization and simulated data generated to be comparable to the actual data.
Study design: Correlational analysis of actual patient satisfaction data, followed by a simulation study where response bias was modeled, with comparison of results from biased and unbiased samples.
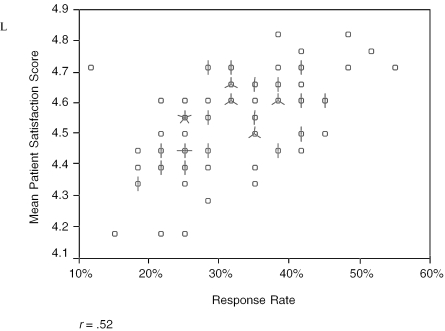
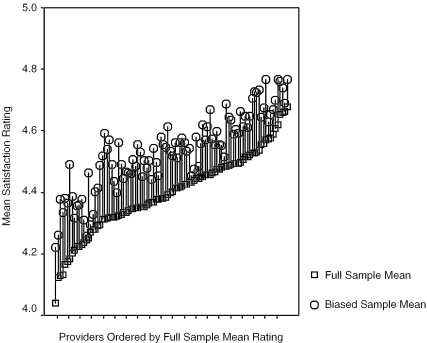
Principal findings: A positive correlation was found between mean patient satisfaction rating and response rate in the actual patient satisfaction data. Simulation results suggest response bias could lead to overestimation of patient satisfaction overall, with this effect greatest for physicians with the lowest satisfaction scores.
Conclusions: Findings suggest that response bias may significantly impact the results of patient satisfaction surveys, leading to overestimation of the level of satisfaction in the patient population overall. Estimates of satisfaction may be most inflated for providers with the least satisfied patients, thereby threatening the validity of provider-level comparisons.
Figures
References
-
- Asch D, Jedrziewski M, Christakis N. “Response Rates to Mail Surveys Published in Medical Journals.”. Clinical Epidemiology. 1997;50(10):1129–36. - PubMed
-
- Band P, Spinelli J, Threlfall W, Fang R, Le N, Gallagher R. “Identification of Occupational Cancer Risks in British Columbia. Part 1: Methodology Descriptive Results and Analysis of Cancer Risks by Cigarette Smoking Categories of 15,463 Incident Cancer Cases.”. Journal of Occupational and Environmental Medicine. 1999;41(4):224–32. - PubMed
-
- Barkley WM, Furse DH. “Changing Priorities for Improvement: The Impact of Low Response Rates in Patient Satisfaction.”. Joint Commission Journal on Quality Improvement. 1996;22(6):427–33. - PubMed
-
- Benfante R, Reed D, MacLean C, Kagan A. “Response Bias in the Honolulu Heart Program.”. American Journal of Epidemiology. 1989;130(6):1088–100. - PubMed
-
- Carlson MJ, Blustein J, Fiorentino N, Prestianni F. “Socioeconomic Status and Dissatisfaction Among HMO Enrollees.”. Medical Care. 2000;38(5):508–16. - PubMed
MeSH terms
LinkOut - more resources
Full Text Sources
