. 2002 Dec 24;99(26):16748-53.
doi: 10.1073/pnas.252625999. Epub 2002 Dec 12.

Molecular conformation of a peptide fragment of transthyretin in an amyloid fibril

Affiliations

Molecular conformation of a peptide fragment of transthyretin in an amyloid fibril

Christopher P Jaroniec et al. Proc Natl Acad Sci U S A. .

Abstract

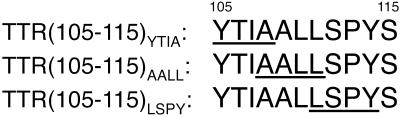
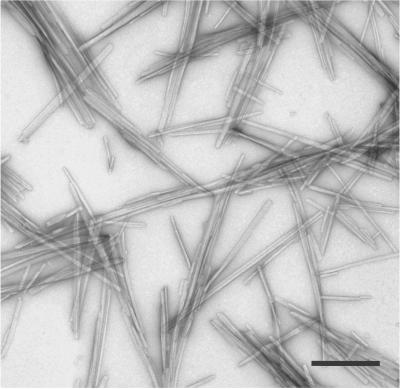
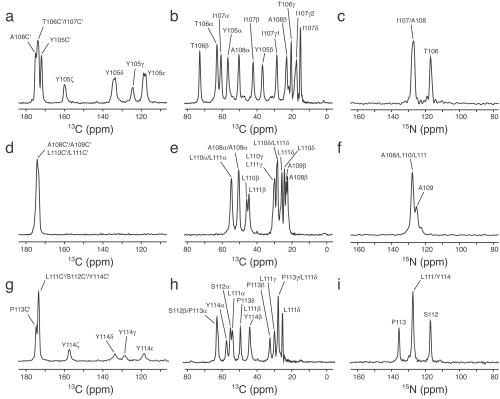
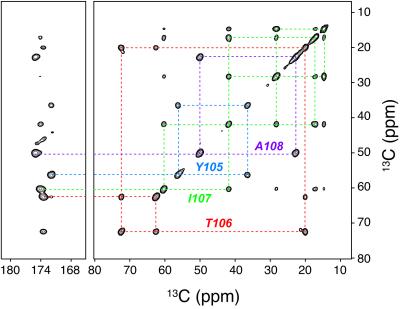
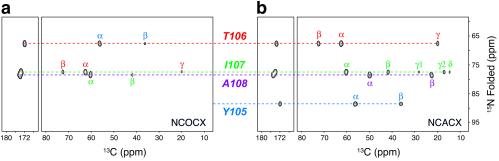
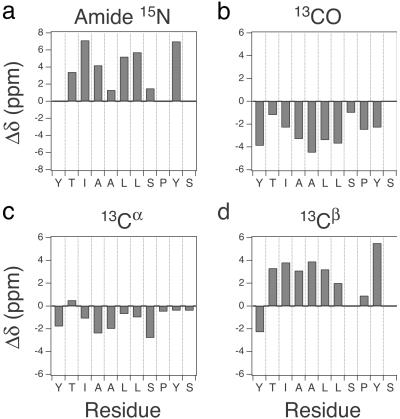
The molecular conformation of peptide fragment 105-115 of transthyretin, TTR(105-115), previously shown to form amyloid fibrils in vitro, has been determined by magic-angle spinning solid-state NMR spectroscopy. 13C and 15N linewidth measurements indicate that TTR(105-115) forms a highly ordered structure with each amino acid in a unique environment. 2D 13C-13C and 15N-13C-13C chemical shift correlation experiments, performed on three fibril samples uniformly 13C,15N-labeled in consecutive stretches of 4 aa, allowed the complete sequence-specific backbone and side-chain 13C and 15N resonance assignments to be obtained for residues 105-114. Analysis of the 15N, 13CO, 13Calpha, and 13Cbeta chemical shifts allowed quantitative predictions to be made for the backbone torsion angles phi and psi. Furthermore, four backbone 13C-15N distances were determined in two selectively 13C,15N-labeled fibril samples by using rotational-echo double-resonance NMR. The results show that TTR(105-115) adopts an extended beta-strand conformation that is similar to that found in the native protein except for substantial differences in the vicinity of the proline residue.


Figures

Fig 1.
Fig 1.
Amino acid sequence of TTR(105–115) and labeling scheme used for the resonance assignments experiments. (U-13C,15N)-labeled residues are underlined.
Fig 2.
Fig 2.
Electron micrograph of TTR(105–115) fibrils. Amyloid fibrils were diluted to 100–200 μg/ml and negatively stained by using 2% (wt/vol) uranyl acetate. Fibrils were viewed in a Jeol 1200EX transmission electron microscope, using an accelerating voltage of 80 kV. (Scale bar: 200 nm.)
Fig 3.
Fig 3.
1D 13C and 15N MAS NMR spectra of (U-13C,15N)-labeled TTR(105–115) fibrils. 13C carbonyl and aromatic (a, d, and g), 13C aliphatic (b, e, and h), and 15N amide (c, f, and i) spectral regions are shown for the TTR(105–115)YTIA (ac), TTR(105–115)AALL (df), and TTR(105–115)LSPY (gi) samples. 13C and 15N spectra were acquired by using the ramped CP pulse sequence (see text) with 128 and 512 scans, respectively, a 3-s recycle delay, and spinning frequencies of 8.929 kHz (ac), 10.87 kHz (df), and 10.0 kHz (gi).
Fig 4.
Fig 4.
2D 13C-13C correlation spectrum of TTR(105–115)YTIA fibrils. The data were acquired at the spinning frequency of 8.929 kHz by using the proton-driven spin diffusion pulse sequence with a 10-ms 13C-13C mixing time (see text). The 2D data set was acquired according to Ruben and coworkers (36), with 200 complex points in the indirect dimension and the increment of 40 μs, resulting in the total t1 evolution time of 8 ms. Sixty-four transients were averaged per point with a 3-s recycle delay, resulting in the total 2D acquisition time of ≈22 h. The intraresidue one-bond correlations are indicated by colored dotted lines as follows: Y105, blue; T106, red; I107, green; and A108, indigo.
Fig 5.
Fig 5.
2D 15N-13C-13C correlation spectra of TTR(105–115)YTIA fibrils. The NCOCX spectrum (a) correlates the 15Ni and 13Ci-1 resonances, and the NCACX spectrum (b) correlates the 15Ni and 13Ci resonances. The data were acquired by using the NCOCX and NCACX pulse sequences (see text), with a 3-ms 15N-13CO or 15N-Cα band-selective CP transfer followed by a 10-ms 1H-driven spin-diffusion 13C-13C mixing, and the spinning frequency of 8.929 kHz. The 2D data set was acquired according to Ruben and coworkers (36), with 21 complex points in the indirect dimension and the increment of 0.4 ms, resulting in the total t1 evolution time of 8 ms. A total of 256 transients were averaged per point and a 3-s recycle delay was used, resulting in the total 2D acquisition time of ≈10 h. The residues participating in the 15N-13C correlations are labeled as follows: Y105, blue; T106, red; I107, green; and A108, indigo.
Fig 6.
Fig 6.
Secondary 15N and 13C chemical shifts in TTR(105–115) fibrils. The secondary shifts (Δδ) for amide 15N (a), 13C carbonyl (b), 13Cα (c), and 13Cβ (d) resonances were calculated as Δδ = δEXP − δRC, where δEXP and δRC are the experimentally observed and random coil chemical shifts in ppm, respectively. The random coil shifts correspond to the values used by the talos program (39) to provide quantitative predictions for the torsion angles φ and ψ (compare Table 2). The secondary shifts for Y105 15N, S115 15N, S115 13CO, and S115 13Cβ could not be calculated; Y105 is the N-terminal residue and S115 was not (U-13C,15N) labeled in any of the samples (S115 13Cα chemical shift was obtained by using a selectively labeled sample).
Fig 7.
Fig 7.
Backbone 13C-15N distances measured in selectively labeled TTR(105–115) fibrils by using REDOR. The schematic of the peptide backbone and the specific distances measured are shown (a). Distances indicated in a as 1 and 2 were measured in fibrils isotopically labeled at A108 13CO, L111 13Cα, and L110 15N and distances indicated as 3 and 4 were measured in fibrils labeled at S112 13CO, S115 13Cα, and Y114 15N. Experimental (circles) and simulated (lines) REDOR S/S0 curves are shown (b). The experimental curves correspond to the distances: A108 CO-L110 N (formula image
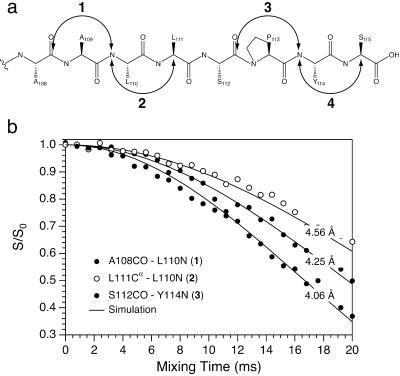
), L111 Cα-L110 N (○), and S112 CO-Y114 N (•). The measured distances are indicated in b and summarized in Table 3 (the S115 Cα-Y114 N measurement was omitted for clarity). Spectra were acquired with 320–384 transients and the spinning frequency of 10.0 kHz ± 5 Hz.
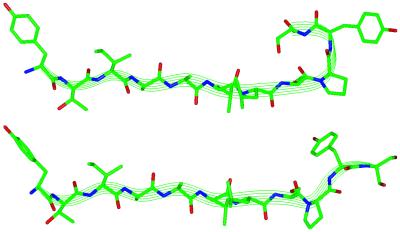
Fig 8.
Fig 8.
X-ray structure of the peptide fragment corresponding to residues 105–115 in WT TTR (13) (Upper) and the backbone model for the TTR(105–115) peptide in the fibrillar state constructed by using the φ and ψ angles in Table 2 (Lower). The Y105 and T106 backbone torsion angles used in the model were obtained from SSNMR measurements of internuclear distances and torsion angles (unpublished data) analogous to those published in refs. . No constraints are available for ψS115 and the experiments designed to probe side-chain χ angles are currently in progress (unpublished data). These moieties are present for illustration purposes only and their conformations in the model correspond to those found in WT TTR (13). The figure was prepared by using the program insight ii version 2000 (Accelerys, San Diego).

References

    1. Sunde M. & Blake, C. C. F. (1998) Q. Rev. Biophys. 31, 1-39. - PubMed
    1. Kelly J. W. (1998) Curr. Opin. Struct. Biol. 8, 101-106. - PubMed
    1. Guijarro J. I., Sunde, M., Jones, J. A., Campbell, I. D. & Dobson, C. M. (1998) Proc. Natl. Acad. Sci. USA 95, 4224-4228. - PMC - PubMed
    1. Chiti F., Webster, P., Taddei, N., Clark, A., Stefani, M., Ramponi, G. & Dobson, C. M. (1999) Proc. Natl. Acad. Sci. USA 96, 3590-3594. - PMC - PubMed
    1. Griffin R. G. (1998) Nat. Struct. Biol. 5, 508-512. - PubMed

Publication types