. 2002 Dec;130(4):1894-907.
doi: 10.1104/pp.008441.

Light-dependent death of maize lls1 cells is mediated by mature chloroplasts

Affiliations

Light-dependent death of maize lls1 cells is mediated by mature chloroplasts

John Gray et al. Plant Physiol. 2002 Dec.

Abstract

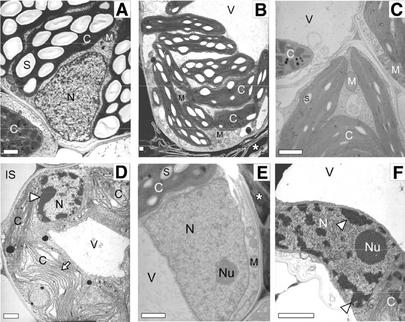
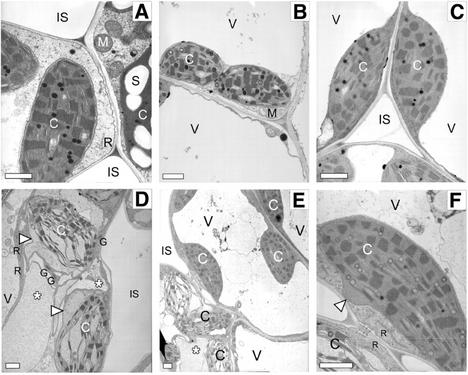
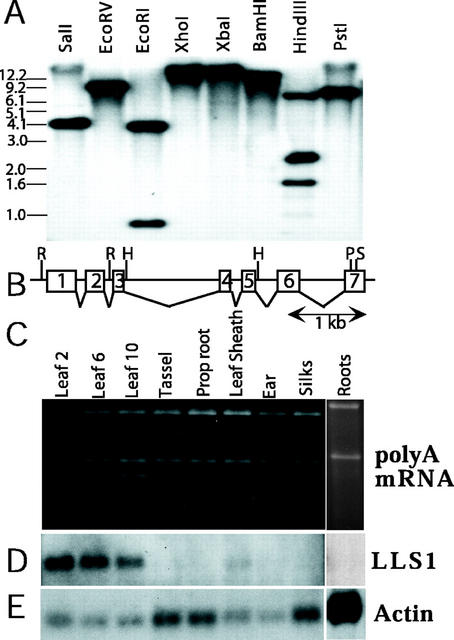
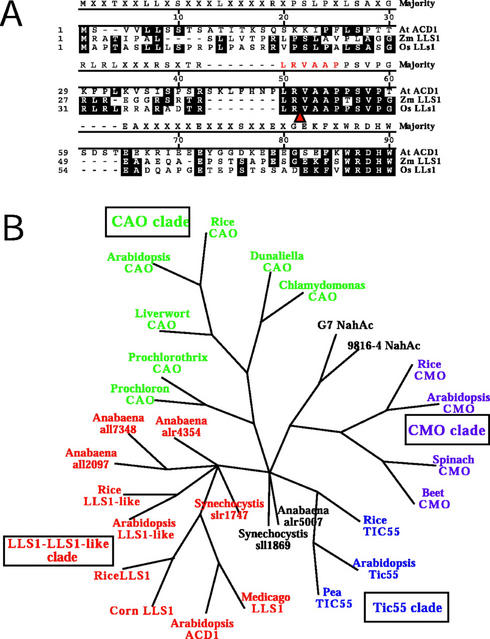
We reported previously the isolation of a novel cell death-suppressing gene from maize (Zea mays) encoded by the Lls1 (Lethal leaf spot-1) gene. Although the exact metabolic function of LLS1 remains elusive, here we provide insight into mechanisms that underlie the initiation and propagation of cell death associated with lls1 lesions. Our data indicate that lls1 lesions are triggered in response to a cell-damaging event caused by any biotic or abiotic agent or intrinsic metabolic imbalance--as long as the leaf tissue is developmentally competent to develop lls1 lesions. Continued expansion of these lesions, however, depends on the availability of light, with fluence rate being more important than spectral quality. Double-mutant analysis of lls1 with two maize mutants oil-yellow and iojap, both compromised photosynthetically and unable to accumulate normal levels of chlorophyll, indicated that it was the light harvested by the plant that energized lls1 lesion development. Chloroplasts appear to be the key mediators of lls1 cell death; their swelling and distortion occurs before any other changes normally associated with dying cells. In agreement with these results are indications that LLS1 is a chloroplast-localized protein whose transcript was detected only in green tissues. The propagative nature of light-dependent lls1 lesions predicts that cell death associated with these lesions is caused by a mobile agent such as reactive oxidative species. LLS1 may act to prevent reactive oxidative species formation or serve to remove a cell death mediator so as to maintain chloroplast integrity and cell survival.


Figures

Figure 1
Figure 1
Histological features and inducible expression of lls1 lesion phenotype during development. A, White light trans-illumination of an lls1 lesion (5×). B, Trypan blue staining in area of necrosis of same lesion, as in A. C, Callose plugging of plasmadesmatal fields in BS cells of an lls1 plant. Picture shows aniline blue-stained unsectioned leaf tissue observed under UV light. Black arrow indicates an individual BS cell outside the periphery of the observable dying cells (which is to the left of the field) that has begun to deposit callose in the plasmadesmatal fields. The white arrow indicates the location of a neighboring xylem cell in the vascular bundle. D, Cartoon indicating bundle sheath (BS) and xylem cell boundaries in A. The plasmadesmatal pit fields, containing up to 100 plasmadesmata/pit fields, are highlighted for one cell in blue. E, White light trans-illumination of an lls1 lesion (40×). F, Blue-light autofluorescence of same lesion as in E. G, Developmental expression of lls1 lesions. Field-grown lls1-ref/lls1-ref plant at the nine-leaf stage. H, Close-up view of typical spreading lesions on an expanded leaf of an lls1-ref/lls1-ref plant grown under field conditions. Occasionally, the concentric rings exhibit a dark coloration as shown here. I, Close-up view of field-grown lls1 lesions showing the concentric ring appearance of lesions and elongate shape of lesions. J, Time lapse series showing expansion of an individual lls1 lesion over a period of 96 h. The ruler markings in each picture are 1 mm apart. K, Lesions induced in an lls1/lls1 plant 7 d after infection with a nonpathogenic strain of C. carbonum. L, Lesions induced in a region of an lls1/lls1 leaf by pinprick wounding 4 d earlier. This region of the leaf was competent for lesion formation but normal spontaneous lesions had not yet progressed to this region of the leaf. M, Spontaneous lesion development on an lls1/lls1 plant from a population segregating for Les101 and lls1. Lesions exhibit a low density. N, Spontaneous lesion development on an Les101 plant from a population segregating for Les101 and lls1. Lesions exhibit a high density. O, Spontaneous lesion development on an Les101/+ lls1/lls1 plant from a population segregating for Les101 and lls1. Lesions are initiated as les101 lesions and progress to an lls1 phenotype with a density that of Les101 lesions.
Figure 2
Figure 2
Requirement of light for lesion development and suppression of the lls1 phenotype in photosynthetically compromised mutants. A, Multiple initiation points for cell death during diurnal cycle. Image shows close-up view of a dead lls1/lls1 lesioned leaf that was grown with an approximately 16-h-light/8-h-dark cycle. The center of each set of concentric rings represents the initiation points of cell death in this leaf region. B, “Wave” of cell death during continuous illumination. Image shows close-up view of a dying lls1/lls1 lesioned leaf that was grown under continuous illumination in a growth chamber. Cell death is seen to process as a wave from the tip of the leaf toward the base as opposed to a confluent “leaf spot” pattern. C, Requirement of light for lesion formation in an lls1/lls1 plant. The leaf shown was protected by wrapping aluminum foil around the region indicated by the arrow. Lesions developed in the region exposed to light but not in the protected region. A similar protective effect was observed for lesions induced by pinprick wounding (not shown). D, Light intensity versus wavelength experimental arrangement. Leaf regions not yet exhibiting lesions were protected by foil or a transparent plexiglass filter (red for the leaf shown here) around the region indicated by the arrow. After lesion formation on the lower side of the covered region, the filter was removed and the underlying tissue examined for lesions. Here, a red plexiglass filter 3 mm in thickness prevented lesion formation. E, Suppression of lls1 lesion formation in pale-green or albino sectors of an iojap (ij) mutant. Lesions developed in an lls1/lls1 ij/ij plant but only in dark-green tissue. Lesions formed on either side of pale green or albino sectors but never within the albino sectors. F, Suppression of lls1 lesion formation in pale-green or albino sectors of an iojap (ij) mutant. Lesions developing in a narrow green sector propagate lengthways but not into the neighboring albino sectors. G, Suppression of lls1 lesion formation in pale-green or albino sectors of an iojap (ij) mutant. In this instance, an lls1 lesion appears to “traverse” a narrow pale green sector (arrow). H, Les4 lesions will form in the albino sectors of an iojap (ij) mutant. The lesions of the dominant lesion mimic les4 formed in both pale-green and albino sectors (shown) of a Les4/+ ij/ij double mutant plant. I and J, Albino sector of an ij/lls1 leaf traversed by an lls1 lesion is still alive. The dead tissue of a leaf section viewed by white light in I is revealed by trypan blue staining in J. K, Suppression of lls1 lesion formation in pale-green sectors of an ncs7 mutant. Lesions developed in an lls1/lls1 NCS2 plant but only in dark-green tissue. L, Suppression of lls1 lesion formation in an oy1-700 mutant. Similarly positioned leaves from field-grown plants of the same age are compared from a population segregating for lls1 and oy1-700. The plant on the right (lls1/lls1 Oy1-700) exhibits typical lls1 lesion development, whereas the plant on the left (lls1/lls1 oy1-700/+) exhibited smaller lesions that did eventually coalesce but at a greatly reduced rate. The reduction of lesion formation in lls1/lls1 oy1-700/+ plants often caused the suppression of lls1/lls1 lethality (permitting seed set).
Figure 3
Figure 3
Transmission electron microscopy of BS cell chloroplasts and nuclei in injured and uninjured (21 h post-pinprick wounding) wild-type and lls1 leaves. A, BS cell in uninjured wild-type leaf tissue. B, BS cell adjoining dead cells in injured wild-type leaf tissue. Asterisk indicates location of dead cell. C, BS cell in uninjured lls1 tissue. D, BS cell adjoining dead cell in injured lls1 leaf tissue. An increased amount of heterochromatin (arrowhead) is present in the nucleus. Note also the apparent folding of the thylakoid membranes (arrow). E, Nucleus of a BS cell adjoining a dead cell in injured wild-type leaf tissue. Asterisk indicates location of dead cell. Note the small amount of heterochromatin. F, Nucleus of a BS cell adjoining a dead cell in injured lls1 leaf tissue. A large amount of heterochromatin is present in this nucleus (arrowheads). Bars = 1 μm. n, Nucleus; Nu, nucleolus; C, chloroplast; S, starch granule; M, mitochondrion; V, vacuole; R, rough endoplasmic reticulum; IS, intercellular space.
Figure 4
Figure 4
Transmission electron microscopy of mesophyll cell chloroplasts and nuclei in injured and uninjured (21 h post-pinprick wounding) wild-type and lls1 leaves. A, Mesophyll cell chloroplasts in uninjured wild-type leaf tissue. B, Mesophyll cell chloroplasts adjoining dead cells in injured wild-type leaf tissue. C, Mesophyll cell chloroplasts in uninjured lls1 leaf tissue. Chloroplasts exhibit granal stacking (not observed in Fig. 3C). D, Mesophyll cell chloroplasts adjoining dead cells in injured lls1 leaf tissue. Chloroplasts are dramatically swollen as seen by the location of the chloroplast envelope (arrowheads). The cytoplasm is vacuolated (asterisks), although endoplasmic reticulum, mitochondria, and Golgi (arrows) appear normal in structure. E, Portions of three mesophyll cells in injured lls1 leaf. The chloroplasts in the cell closest to the injury (asterisk) are greatly swollen. F, Fine detail of one of the chloroplasts in the adjoining cell. No other ultrastructural alterations are apparent in this cell except for the swelling visible on one of the cell's chloroplasts (arrowhead). Bars = 1 μm. C, Chloroplast; S, starch granule; M, mitochondrion; V, vacuole; R, rough endoplasmic reticulum; G, Golgi apparatus; IS, intercellular space.
Figure 5
Figure 5
The Lls1 gene is a single-copy gene and the Lls1 transcript is expressed in photosynthetic tissues. A, Southern-blot analysis. Maize B73 DNA was digested with the indicated enzymes, blotted, and probed with an Lls1 cDNA probe. Most lanes exhibit a single band and those with multiple bands are explicable by multiple restriction sites in the B73 structural gene. Size standards are indicated in kb. B, Gene structure of the maize Lls1 gene. The intron/exon structure of the Lls1 gene was determined by comparing the sequence of the B73 genomic sequence with an Lls1 cDNA sequence. Blocks indicate exons. Restriction sites: RI, EcoRI; HIII, HindIII; PI, PstI; and SI, SalI. C, Poly(A+)-enriched RNA from the various maize tissues was subjected to northern analysis using maize Lls1 cDNA as probe. One microgram of poly(A+) RNA was loaded per lane except for root tissue, which was deliberately overloaded. Picture of ethidium bromide-stained gel shows near equal loading of samples from indicated tissues of a mature 13-leaf B73 plant. D, Northern blot showing that a unique lls1 transcript is detectable in fully photosynthetic green leaves and at a lower level in leaf sheath but not in other tissues. E, To normalize RNA loading, the blot was stripped and rehybridized with a maize actin probe. This experiment was repeated twice with similar results.
Figure 6
Figure 6
Predictive targeting of LLS1 to chloroplast and phylogenetic comparison of LLS1 with non-heme Fe-binding proteins from bacteria and plants. A, Alignment of amino termini of LLS1 and ACD1 proteins shows low conservation of sequence in this region. Arrow indicates the conserved cleavage site for a chloroplast transit peptide as predicted using the ChloroP algorithm. B, Cladogram of consensus tree obtained from maximal parsimony bootstrap analysis using the indicated proteins as operational taxonomic units. The consensus tree reconstructs the evolutionary relationship between LLS1 and other non-heme Fe-binding proteins. The proteins are labeled by species name or bacterial strain number in which they are found (for accession nos. and biocomputational methods, see “Materials and Methods”). Clades of related proteins are color shaded as follows: red, LLS1 and LLS1-like homologs in various plants and cyanobacteria; black, bacterial ring hydroxylating enzymes; purple, plant choline monooxygenase (CMO) enzymes; green, plant and cyanobacterial chlorophyll a oxygenase CAO enzymes; blue, pea (Pisum sativum) TIC55 Rieske Fe-sulfur protein putatively associated with transport through inner chloroplast membrane and related plant proteins.

References

    1. Aist JR, Gold RE, Bayles CJ, Morrison GH, Chandra S, Israel HW. Evidence that molecular components of papillae may be involved in ml-o resistance to barley powdery mildew. Physiol Mol Plant Pathol. 1988;33:17–32.
    1. Altschul SF, Gish W, Miller W, Myers E, Lipman D. Basic local alignment search tool. J Mol Biol. 1990;215:403–410. - PubMed
    1. Ausubel FM, Brent R, Kingston RE, Moore DD, Seidman JG, Smith JA, Struhl K. Current Protocols in Molecular Biology. New York: John Wiley & Sons, Inc.; 1994.
    1. Bestwick CS, Brown IR, Bennett MHR, Mansfield JW. Localization of hydrogen peroxide accumulation during the hypersensitive reaction of lettuce cells to Pseudomonas syringae pv phaseolicola. Plant Cell. 1997;9:209–221. - PMC - PubMed
    1. Brodersen P, Petersen M, Pike HM, Olszak B, Skov S, Odum N, Jorgensen LB, Brown RE, Mundy J. Knockout of Arabidopsis ACCELERATED-CELL-DEATH11encoding a sphingosine transfer protein causes activation of programmed cell death and defense. Genes Dev. 2002;16:490–502. - PMC - PubMed

Publication types

MeSH terms

LinkOut - more resources