. 2002 Dec 15;545(3):739-50.
doi: 10.1113/jphysiol.2002.026823.

The relation between charge movement and transport-associated currents in the rat GABA cotransporter rGAT1

Affiliations

The relation between charge movement and transport-associated currents in the rat GABA cotransporter rGAT1

Riccardo Fesce et al. J Physiol. .

Abstract

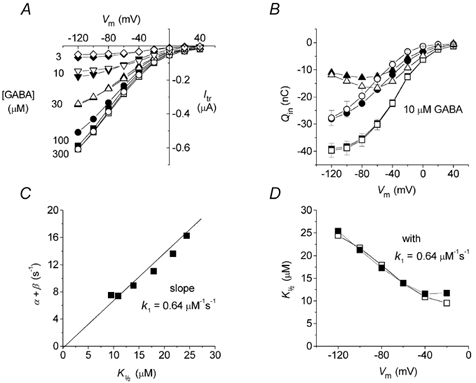
Most cotransporters characteristically display two main kinds of electrical activity: in the absence of organic substrate, transient presteady-state currents (I(pre)) are generated by charge relocation during voltage steps; in the presence of substrate, sustained, transport-associated currents (I(tr)) are recorded. Quantitative comparison of these two currents, in Xenopus oocytes expressing the neural GABA cotransporter rGAT1, revealed several unforeseen consistencies between I(pre) and I(tr), in terms of magnitude and kinetic parameters. The decay rate constant (r) of I(pre) and the quantity of charge displaced to an inner position in the transporter (Q(in)(0)) depended on voltage and ionic conditions. Saturating GABA concentrations, applied under the same conditions, suppressed I(pre) (i.e. Q(in)( infinity ) = 0) and produced a transport-associated current with amplitude I(tr) = Q(in)(0)r. At non-saturating levels of GABA, changes of I(tr) were compensated by corresponding variations in Q(in), such that I(pre) and I(tr) complemented each other, according to the relation: I(tr) = (Q(in)(0) - Q(in)) r. Complementarity of magnitude, superimposable kinetic properties and equal dependence on voltage and [Na(+)](o) point to the uniqueness of the charge carrier for both processes, suggesting that transport and charge migration arise from the same molecular mechanism. The observed experimental relations were correctly predicted by a simple three-state kinetic model, in which GABA binding takes place after charge binding and inward migration have occurred. The model also predicts the observed voltage dependence of the apparent affinity of the transporter for GABA, and suggests a voltage-independent GABA binding rate with a value around 0.64 microM(-1) s(-1).


Figures

Figure 1
Figure 1. Main properties of Ipre and Itr
A, Ipre in response to voltage pulses to -120, -80, 0 and +40 mV from Vh = -40 mV, after subtraction of the corresponding records in the presence of SKF89976A. B, Q-V curve obtained from integration of the transients in A and vertically offset, in order to make it start from zero at positive values. Vm, membrane potential. Fitting the sigmoid with a Boltzmann function: Q =Qmax/{1 + exp[-(V1/2 - V)/s]}, gives in this oocyte: Qmax = -26.7 nC, V1/2 = -30.3 mV and log-slope s = 21.2 mV). C, charge equilibration rate (▪) and unidirectional rate constants (α, ○; and β, ▵) obtained from the traces in A. D, isolated Itr in response to the same voltage protocol as in A; the dotted line indicates zero current. E, steady-state Itr from records in D. All data in A-E are from the same oocyte. F, relation between Itr at -120 mV and Qmax from 16 individual oocytes; the linear regression (r = 0.97) gives a slope of 24 ± 2 nA nC−1 (or s−1). Vertical calibration bar represents 0.25 μA for A and 0.5 μA for D.
Figure 2
Figure 2. Two-pulse experiment aimed to detect Itr reversal
A, sample current traces, after subtraction of the corresponding records in SKF89976A. The membrane voltage was initially stepped to -120 mV from Vh = -40 mV for 400 ms, after which a second step to variable voltages between -120 and +80 mV was applied. B, instantaneous I-V relation, in which the value of the current at the beginning of the second step is plotted against its voltage level. Data are means ± s.e.m. from 5 oocytes.
Figure 3
Figure 3. Correspondence between charge movement and transport current
A, comparison between Qinvs. V curve and the ratio Itr/r. The filled squares represent the result of dividing Itr (from Fig. 1E) by the charge equilibration rate of Fig. 1C (▪). Open squares are replotted from Fig. 1B. B, comparison between measured Itr (open symbols) and the product Qinr (filled symbols) for 3 oocytes showing different levels of expression (values of Qmax in nC are indicated on the left).
Figure 4
Figure 4. Effects of external Na+ concentration
A, the Q-V curves in the absence of GABA are negatively shifted without change in Qmax.B, the rate vs. V curves are also shifted by reductions in external Na+, with a concomitant increase in minimum rate. C, effects of Na+ on Itr (induced by 100 μm GABA); open symbols are experimental data and filled symbols are data calculated from Itr =Qinr, with values taken from A and B. Symbols correspond to the following Na+ concentrations (mm): □, ▪: 98; ○, •:, 50; ▵, ▴: 25; ▿, ▾: 12.
Figure 5
Figure 5. Relations between Ipre and Itr in non-saturating [GABA]
A, uncorrected current traces from an oocyte in the presence of the indicated GABA concentrations and in response to voltage clamp pulses to -120, -80, 0 and +40 mV from Vh = -40 mV. B, traces resulting from Aa - Ac and Ab - Ac, respectively, and after subtraction of the steady-state current. C, results of the integration of the transients in Ba (□) and Bb (○); averages between ‘on’ and ‘off’ areas ± s.e.m are shown; fitting of the squares with a sigmoid function gave: Qmax = -48.4 nC, V1/2 = -38.4 mV and log-slope = 19.8 mV. D, rate constants from the same oocyte at the indicated GABA concentrations. E, Itr from the same oocyte at the indicated GABA concentrations.
Figure 6
Figure 6. Interconversion between intramembrane and transmembrane charge movements
A, average curves of the charge at the internal transporter position (see text), from 5 oocytes analysed as in Fig. 5. ▵, difference between □ (no GABA) and ○ (10 μm GABA); ▴ are derived from eqn (5). B, average charge transfer rates from the same oocytes (⋄, r; ▵, ○: unidirectional rates). C, average Itr at the indicated GABA concentrations; open symbols are experimental data, filled symbols represent the currents calculated from eqn (4) using the values from the corresponding symbols in A multiplied by the rate in B (▪ (C) =□(A) ×⋄ (B); ▴ (C) =▵ (A) ×⋄ (B)). D, GABA apparent affinity evaluated as the concentration giving rise to half Itr at each potential.
Figure 7
Figure 7. Model representing the minimal kinetic scheme necessary to reproduce the experimental results and correlations
The transporter is depicted as the light grey oval spanning the membrane; mobile charge (e.g. Na+ ions) is represented by the black circles, while the dark grey rectangle symbolizes GABA. A, in the absence of GABA the transporters equilibrate between the two states, empty (at left) and charged (right), according to the unidirectional rates α and β.B, when GABA is present, it can bind to the charged state with rate k1; in order to account for the experimental results the complex formed by the transporter, GABA and ions must dissociate instantaneously, releasing ions and GABA to the cytosol. The transporter returns immediately to the ‘empty’ state.
Figure 8
Figure 8. Reconstruction of experimental findings from the model of Fig. 7
A, transport-associated currents in the presence of different concentrations of GABA; open symbols are experimental points (averaged from 5 oocytes), while filled symbols are calculated from eqn (A1) using α, β and Qmax averaged from the same oocytes. B, Qin in 0 (□, ▪) and 10 μm GABA (○, •); ▵ and ▴, difference between squares and circles; open symbols are experimental data from the same oocytes of Fig. 6, and filled symbols are calculated from eqns (A4) and (A6). C, plot of the charge equilibration rate r = (α+β) vs. K1/2; according to eqn (A3), the slope represents k1.D, voltage dependence of K1/2; □, experimental data (from Fig. 6); ▪, data derived from eqn (A3), using the k1 value from C.

Similar articles

Cited by

References

    1. Armstrong CM, Bezanilla F. Charge movement associated with the opening and closing of the activation gates of the Na channels. Journal of General Physiology. 1974;63:533–552. - PMC - PubMed
    1. Barish ME. A transient calcium-dependent chloride current in the immature Xenopus oocyte. Journal of Physiology. 1983;342:309–325. - PMC - PubMed
    1. Binda F, Bossi E, Giovannardi S, Forlani G, Peres A. Temperature effects on the presteady-state and transport-associated currents of GABA cotransporter rGAT1. FEBS Letters. 2002;512:303–307. - PubMed
    1. Bossi E, Centinaio E, Castagna M, Giovannardi S, Vincenti S, Sacchi VF, Peres A. Ion binding and permeation through the lepidopteran amino acid transporter KAAT1 expressed in Xenopus oocytes. Journal of Physiology. 1999;515:729–742. - PMC - PubMed
    1. Bossi E, Giovannardi S, Binda F, Forlani G, Peres A. Role of anion-cation interactions on the pre-steady-state currents of the rat Na+-Cl−-dependent GABA cotransporter rGAT1. Journal of Physiology. 2002;541:343–350. - PMC - PubMed

Publication types

LinkOut - more resources