. 2002 Dec 15;545(3):783-805.
doi: 10.1113/jphysiol.2002.029249.

Two forms of electrical resonance at theta frequencies, generated by M-current, h-current and persistent Na+ current in rat hippocampal pyramidal cells

Affiliations

Two forms of electrical resonance at theta frequencies, generated by M-current, h-current and persistent Na+ current in rat hippocampal pyramidal cells

Hua Hu et al. J Physiol. .

Abstract

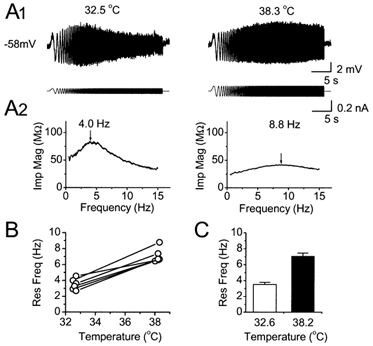
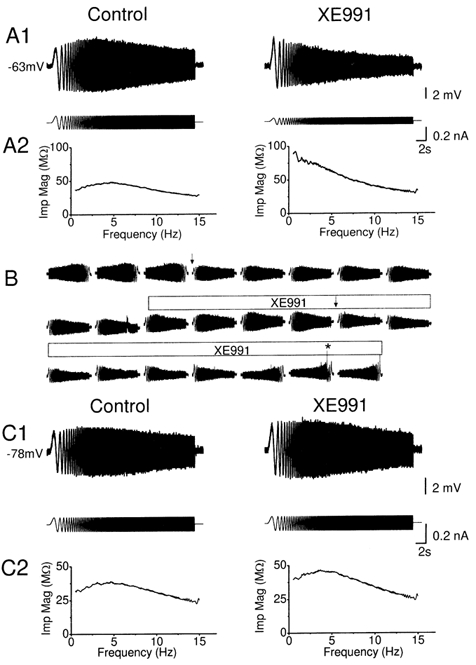
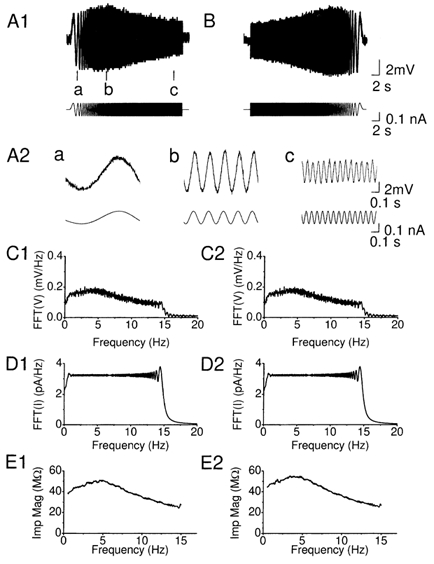
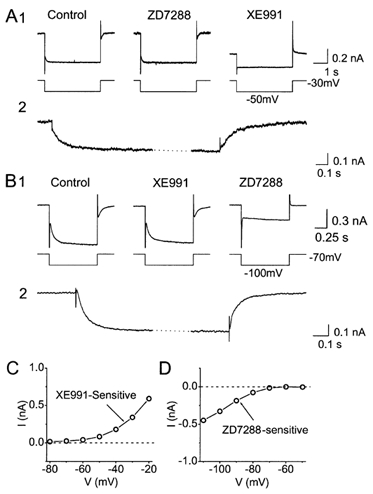
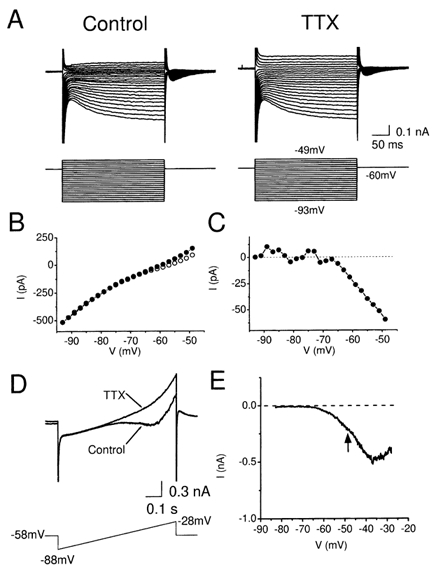
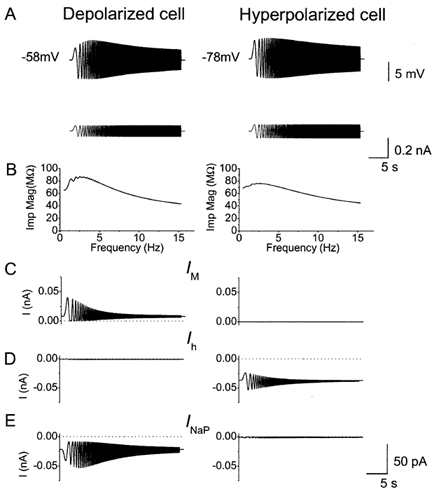
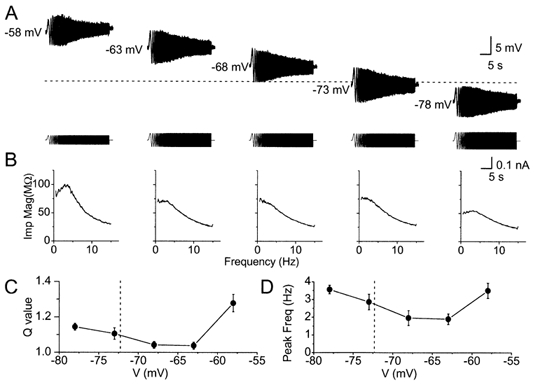
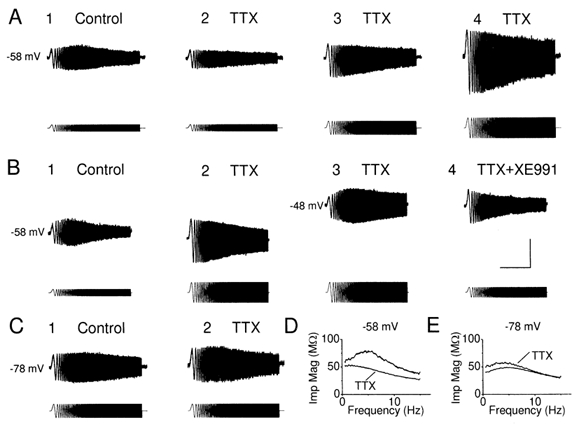
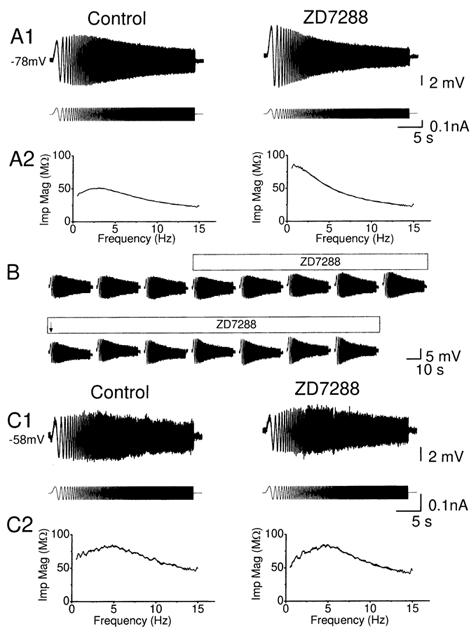
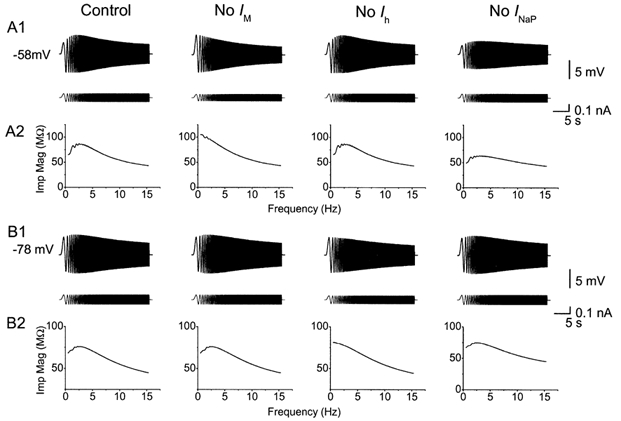
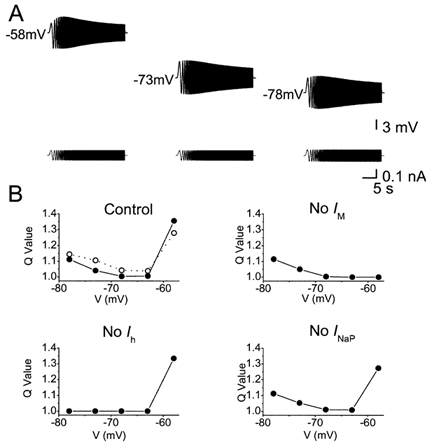
Coherent network oscillations in the brain are correlated with different behavioural states. Intrinsic resonance properties of neurons provide a basis for such oscillations. In the hippocampus, CA1 pyramidal neurons show resonance at theta (theta) frequencies (2-7 Hz). To study the mechanisms underlying theta-resonance, we performed whole-cell recordings from CA1 pyramidal cells (n = 73) in rat hippocampal slices. Oscillating current injections at different frequencies (ZAP protocol), revealed clear resonance with peak impedance at 2-5 Hz at approximately 33 degrees C (increasing to approximately 7 Hz at approximately 38 degrees C). The theta-resonance showed a U-shaped voltage dependence, being strong at subthreshold, depolarized (approximately -60 mV) and hyperpolarized (approximately -80 mV) potentials, but weaker near the resting potential (-72 mV). Voltage clamp experiments revealed three non-inactivating currents operating in the subthreshold voltage range: (1) M-current (I(M)), which activated positive to -65 mV and was blocked by the M/KCNQ channel blocker XE991 (10 microM); (2) h-current (I(h)), which activated negative to -65 mV and was blocked by the h/HCN channel blocker ZD7288 (10 microM); and (3) a persistent Na(+) current (I(NaP)), which activated positive to -65 mV and was blocked by tetrodotoxin (TTX, 1 microM). In current clamp, XE991 or TTX suppressed the resonance at depolarized, but not hyperpolarized membrane potentials, whereas ZD7288 abolished the resonance only at hyperpolarized potentials. We conclude that these cells show two forms of theta-resonance: "M-resonance" generated by the M-current and persistent Na(+) current in depolarized cells, and "H-resonance" generated by the h-current in hyperpolarized cells. Computer simulations supported this interpretation. These results suggest a novel function for M/KCNQ channels in the brain: to facilitate neuronal resonance and network oscillations in cortical neurons, thus providing a basis for an oscillation-based neural code.


Figures

Figure 2
Figure 2. Temperature dependence of the resonance frequency
A1, voltage responses to ZAP current injection at 32.5 and 38.3 °C, from a cell maintained at -58 mV. The resonance (peak) frequency shifted from 4.0 to 8.8 Hz by warming the perfusion medium from 32.5 to 38.3 °C. A2, impedance magnitude plotted as a function of frequency, from the same traces as in A1. The peaks of the impedance magnitude profiles are marked with arrows. B, resonance frequency plotted as a function of the recording temperature for the six cells tested at ≈32.5 °C and again after warming to ≈38.0 °C. In all the cells, the resonance frequency was increased by warming. C, summary diagram showing the temperature effect on the mean resonance frequency. The resonance frequency at 38.20 ± 0.04 °C was significantly higher than at 32.62 ± 0.04 °C (7.09 ± 0.36 vs.3.50 ± 0.28 Hz, n = 6, P = 0.0002, Student's paired t test).
Figure 6
Figure 6. XE991 blocked θ-resonance at depolarized but not at hyperpolarized membrane potential
A1 and C1, typical voltage responses (upper traces) evoked from depolarized (-63 mV, in A1) and a hyperpolarized (-78 mV, in C1) membrane potentials by injecting a ZAP current (lower traces), before and after application of 10 μm XE991. After applying XE991, it was necessary to reduce the amplitude of the ZAP current in order to obtain a voltage response of similar peak-to-peak amplitude as before, because XE991 increased the input resistance. Note that XE991 abolished the resonance at -63 mV indicated by a typical ‘spindle-shaped’ voltage response to ZAP current injection, thus shifting the peak voltage response to the lowest frequency tested (n = 7, P = 0.02, Q = 1.13 ± 0.04 and 1.00 ± 0.00 before and after application of XE991), but had little effect on the resonance at -78 mV (n = 5, P = 0.13, Q = 1.16 ± 0.07 and 1.12 ± 0.06 before and after application of XE991). A2 and C2, impedance magnitude plotted as a function of input frequency before and after XE991, from the same traces as in A1 and A2. B, typical time course of the XE991 (10 μm; indicated by bar above the traces) effect on resonance at a depolarized level (-63 mV). In order to limit the variations in the peak-to-peak amplitude of the voltage response, the peak-to-peak amplitude of the ZAP current was changed at places marked with arrows. To test for time dependence of the responses (cf. Fig. 1B), the ZAP currents were inverted before and after XE991 application (first three and last three traces). No time dependence was detected. Note that the cell fired action potentials in one of the last traces (*).
Figure 1
Figure 1. Subthreshold resonance in CA1 pyramidal cells
A1, membrane potential response of a hippocampal CA1 pyramidal cell (upper trace) to injection of a ZAP function current (lower trace) with linearly increasing frequency (0-15 Hz, over 30 s). The cell was depolarized to -63 mV by steady DC injection. Note that the peak in the voltage response at the point marked b. A2, samples (a-c) of voltage response (upper trace) and the ZAP current (lower trace) corresponding to the times a-c marked in A1, shown at an expanded time scale. B, to test whether the peak reflected frequency-dependent as opposed to time-dependent membrane properties, an inverted ZAP current was injected (1B, lower trace), i.e. with linearly decreasing frequency (15-0 Hz, over 30 s). C1 and 2, fast Fourier transform (FFT) of the membrane potential responses shown in A1 and B (FFT(V)). D1 and 2, FFT of the ZAP function input shown in C1 and C2 FFT(I). E1 and 2, impedance magnitude (Imp Mag) calculated by dividing FFT(V) with FFT(I) (impedance magnitude, Z = FFT(V)/FFT(I)] plotted as a function of input frequency, using the data in B and C. All data in this figure were obtained from the same cell.
Figure 4
Figure 4. Selective elimination of M-current (IM) and H-current (Ih) by the ion channel blockers XE991 and ZD7288
Whole-cell voltage-clamp recordings from CA1 pyramidal cells bathed in 1 μm TTX to block Na+ channels. A1, typical example showing that XE991, but not ZD7288, blocked IM. IM was recorded by giving 4 s-long -20 mV voltage-clamp steps to -50 mV from a holding potential of -30 mV. M-channel closure was seen as a slow inward relaxation (tail current) after stepping to -50 mV, and M-channel reopening as a slow outward relaxation after stepping back to -30 mV. Bath application of 10 μm ZD7288 had no detectible effect, whereas subsequent application of 10 μm XE911 fully blocked IM, abolishing the relaxations and causing an inward shift of the holding current. A2, the XE991-sensitive current, calculated by subtracting the current traces before and after XE991, at an expanded time scale. Note the larger instantaneous jump in the current when stepping from -30 to -50 mV (when most M-channels are open), compared to stepping from -50 to -30 mV (when most M-channels are closed). The example shown in A2 is taken form a different cell than A1 because an A-current evoked by the step to -30 mV partly masked the time course of M-current opening in A1. B1, ZD7288, but not XE991, blocked Ih. The cell was maintained at -70 mV, and stepped to -100 mV for 1 s. Ih activation and deactivation were seen as slow inward and outward relaxations at the beginning and end of the step, respectively. Ih was highly resistant to 10 μm XE991, but was fully blocked by subsequent application of 10 μm ZD7288. B2, the ZD7288-sensitive current, calculated by subtracting the current traces before and after ZD7288, shown at an expanded time scale. C, XE991-sensitive difference current amplitude, obtained by subtraction of currents before and after the application of 10 μm XE991, plotted as a function of membrane potential (V). D, ZD7288-sensitive difference current amplitude, obtained by subtraction of currents before and after the application of 10 μm ZD7288, plotted as a function of membrane potential (V). In C and D, the difference currents were measured at the end of the negative-going voltage step (cf. panels A2 and B2). TTX (1 μm) was applied throughout all experiments (A-D) to block Na+ channels.
Figure 5
Figure 5. Blockade of the persistent Na+ current (INaP) by TTX
A, membrane currents in a CA1 pyramidal cell in response to voltage-clamp steps to different membrane potentials (-93 mV to -40 mV) from a holding potential of -60 mV, before and after bath application of 1 μm TTX. B, steady state current-voltage (I-V) plot of the data from A. The current (I) was measured at the end of the 300 ms voltage steps, before (○) and after (•) TTX application. C, TTX-sensitive current, calculated by subtracting the steady state currents before and after TTX in B, plotted as a function of membrane potential. Note that the TTX-sensitive current started to activate at about -65 mV. D, typical example of currents in response to a ramp voltage commands (from -88 to -28 mV, given once every 10 s) before and after application of TTX (1 μm). The holding potential between the ramp commands was -58 mV. E, TTX-sensitive current, obtained by subtracting the current in response the ramp command before and after application of TTX in D, plotted as a function of membrane potential.
Figure 9
Figure 9. Computer simulation of how M-, h- and NaP-currents contribute to the resonance at depolarized and hyperpolarized membrane potentials
A, voltage response (upper traces) to ZAP current (lower traces) from the model cell maintained at -58 and -78 mV. B, impedance magnitude plotted as a function of input frequency from the traces in A. C-E, IM, Ih and INaP during the response to ZAP current, shown in A. Note that IM and INaP were significantly activated by the ZAP current only at -58 mV. In contrast, Ih was significantly activated by the ZAP current only at -78 mV. Note that IM and Ih were most responsive at low frequencies, whereas INaP could follow the ZAP also at high frequencies.
Figure 3
Figure 3. Voltage dependence of resonance behaviour
A, voltage responses of a CA1 pyramidal cell to ZAP current injections at different membrane potentials (-58 to -78 mV). The different membrane potentials were obtained by different amounts of steady current injection. In order to make the peak-to-peak voltage response similar at different membrane potentials, it was necessary to adjust the amplitude of the ZAP current (lower traces), because of differences in input resistance at different membrane potentials. Note the stronger resonance at depolarized (-58 mV) and hyperpolarized (-78 mV) potentials compared to potentials near the resting level (-72.6 ± 1.2 mV). B, impedance magnitude plotted as a function of input frequency at different membrane potentials of the same cell as in A. C, summary diagram of Q values plotted as a function of membrane potential for all the six cells tested. The Q value indicates the strength of the resonance, and is 1.0 when there is no resonance. D, summary diagram of peak resonance frequency plotted as a function of membrane potential for all the six cells tested. The Q value at -58 mV was significantly higher than that at -78 mV (P = 0.04), indicating stronger resonance at -58 mV. In C and D, each of the six neurons were tested at five different membrane potentials (i.e. n = 6 for each point). When we also included the data from our all other experiments (Figs 1-3 and 6-8), in which each cell was tested only at some potentials, the resulting plots (not shown) were virtually identical to the plots (C and D) for the six completely tested cells.
Figure 8
Figure 8. Effect of TTX on the resonance at different membrane potentials
A, voltage responses to ZAP current before (A1) and after (A2-4), in a cell maintained at subthreshold level. The resonance at depolarized membrane potential was largely reduced by TTX at this membrane potential (n = 5, P = 0.03, Q = 1.17 ± 0.06 and 1.00 ± 0.00 before and after application of TTX). The peak-to-peak amplitude of voltage deflections in response to same ZAP current injection was reduced after TTX (A2), when compared to the control period (A1), due to the ‘amplifying’ effect of INaP. A3, resonance was absent after increasing the peak-to-peak amplitude of ZAP current, so that the peak-to-peak amplitude to voltage deflection was comparable before and after TTX. Resonance was not rescued by increasing the peak-to-peak amplitude of ZAP current to make the voltage response (A4) much larger than control. B1-3, in the presence of TTX, resonance was restored by depolarizing the cell further to -48 mV, whereas it was blocked by XE991 (B4, n = 4). C, voltage response to ZAP current injection from a hyperpolarized membrane potential before (C1) and after TTX (C2), in the same cell shown in A. Note that the resonance at -78 mV was resistant to TTX (n = 5, P = 0.22, Q = 1.17 ± 0.04 and 1.14 ± 0.04 before and after application of TTX). D, impedance magnitude plotted against input frequency, from the traces in A1 and A2. Note that distinct ‘hump’ of impedance magnitude profile close to 5 Hz in control condition disappeared in the presence of TTX. E, impedance magnitude plotted against input frequency, from the traces in C1 and C2. The small increase of the impedance magnitude could be due to rundown of the ‘leak’ current. The scale bars in B4 apply to all records in A-C: 10 s, 10 mV, 420 pA.
Figure 7
Figure 7. ZD7288 blocked θ-resonance at hyperpolarized but not at depolarized membrane potential
A1 and C1, typical voltage response (upper traces) evoked from hyperpolarized (-78 mV, in A1) and depolarized (-58 mV, in C1) membrane potentials by injecting a ZAP current (lower traces), before and after application of 10 μm ZD7288. The resonance at hyperpolarized level (-78 mV) was blocked by ZD7288 (n = 7, P = 0.004, Q = 1.12 ± 0.03 and 1.00 ± 0.00 before and after application of ZD7288), while the resonance at the at depolarized level (-58 mV) was resistant to ZD7288 (n = 4, P = 0.36, Q = 1.19 ± 0.08 and 1.29 ± 0.17 before and after application of ZD7288). A2 and C2, the impedance magnitude, calculated from the data in A1 and C1, is plotted against input frequency before and after ZD7288 application. B, typical time course of blockade of resonance, evoked from a hyperpolarized level. The steady state DC current had to be adjusted before and after ZD7288, due to the hyperpolarization caused by ZD7288. The peak-to-peak amplitude of ZAP current was reduced after ZD7288, at the time marked with an arrow.
Figure 10
Figure 10. Computer simulation showing that resonance at depolarized and hyperpolarized membrane potential is due to different mechanisms
A1, voltage responses (upper trace) to ZAP current (lower trace) from the model cell at -58 mV, before and after removal of IM, Ihor INaP. Resonance at depolarized level was fully blocked by removal of IM, but was resistant to removal of Ih. Removal of INaP reduced the peak-to-peak amplitude of the resonance, but caused little change of resonance frequency at -58 mV. B1, voltage response (upper trace) to ZAP current (lower trace) from the model cell at -78 mV, before and after removal of IM, Ih or INaP. Resonance at -78 mV was resistant to removal of INaP and IM, but was blocked by removing Ih. A2 and B2, impedance magnitude plotted as a function of input frequency, from the traces in A1 and B1, respectively.
Figure 11
Figure 11. Computer simulation showing U-shaped voltage dependence of the resonance strength
A, model simulations (with the same model as in Figs 9-10) of ZAP responses at three different membrane potentials: depolarized (-58 mV), resting potential (-73 mV), and hyperpolarized (-78 mV). B, plots of voltage dependence of resonance strength in the model. Comparison between results with the full model (Control) and with each of the three key ionic currents omitted from the model (No IM, No Ih, No INaP). In each case, the Q value, which indicates strength of resonance, was plotted as a function of the membrane potential (filled circles). In the upper left panel (Control), the experimental data, replotted from Fig. 3C, are shown for comparison (open circles and broken line).

Similar articles

Cited by

References

    1. Alonso A, Klink R. Differential electroresponsiveness of stellate and pyramidal-like cells of medial entorhinal cortex layer II. Journal of Neurophysiology. 1993;70:128–143. - PubMed
    1. Alonso A, Llinas RR. Subthreshold Na+-dependent theta-like rhythmicity in stellate cells of entorhinal cortex layer II. Nature. 1989;342:175–177. - PubMed
    1. Alzheimer C, Schwindt PC, Crill WE. Modal gating of Na+ channels as a mechanism of persistent Na+ current in pyramidal neurons from rat and cat sensorimotor cortex. Journal of Neuroscience. 1993;13:660–673. - PMC - PubMed
    1. Bibbig A, Faulkner HJ, Whittington MA, Traub RD. Self-organized synaptic plasticity contributes to the shaping of gamma and beta oscillations in vitro. Journal of Neuroscience. 2001;21:9053–9067. - PMC - PubMed
    1. Bland BH. The physiology and pharmacology of hippocampal formation theta rhythms. Progress in Neurobiology. 1986;26:1–54. - PubMed

Publication types

MeSH terms

LinkOut - more resources