. 2002 Dec 15;545(3):807-18.
doi: 10.1113/jphysiol.2002.028415.

O2-sensitive K+ channels in immortalised rat chromaffin-cell-derived MAH cells

Affiliations

O2-sensitive K+ channels in immortalised rat chromaffin-cell-derived MAH cells

Ian M Fearon et al. J Physiol. .

Abstract

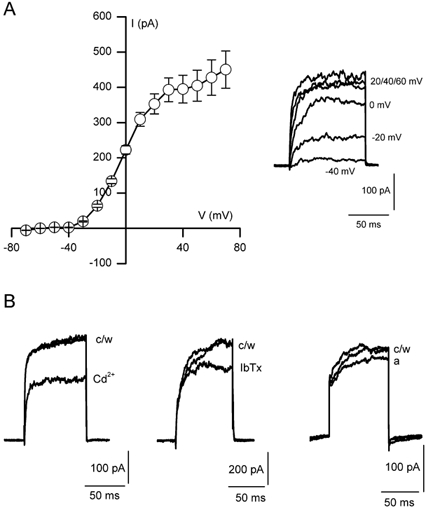
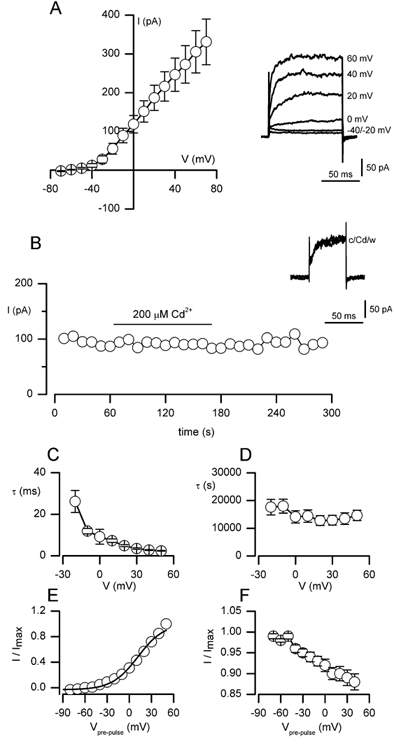
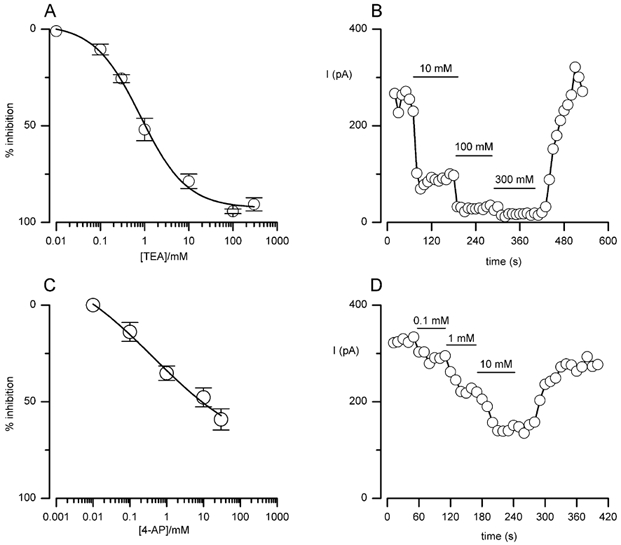
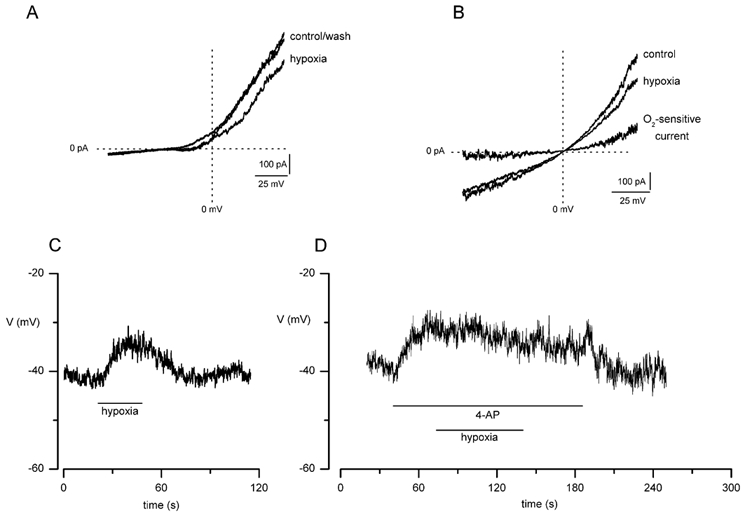
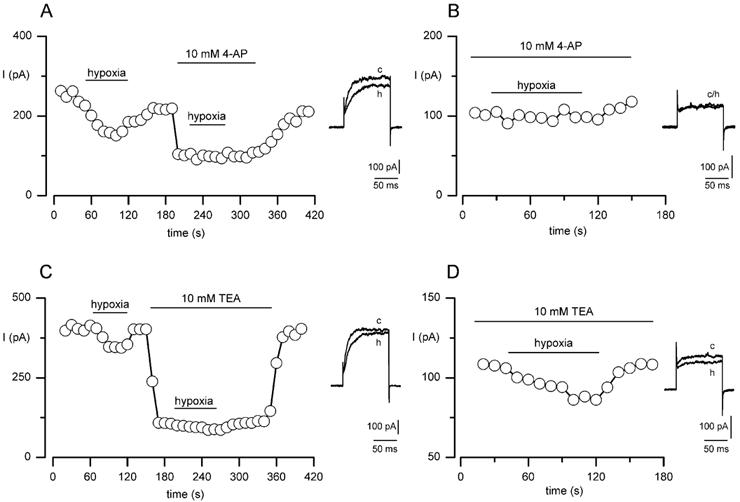
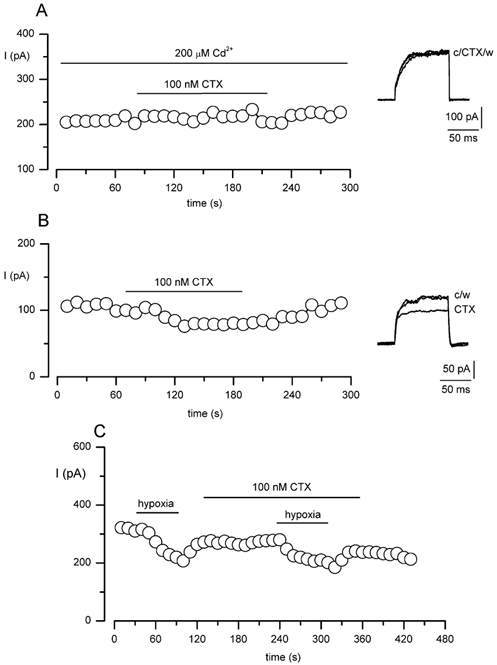
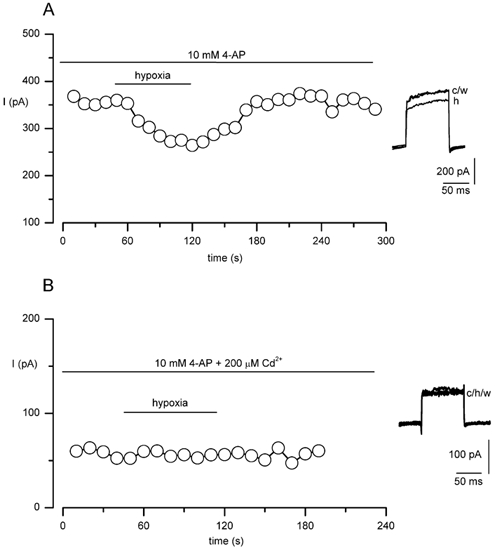
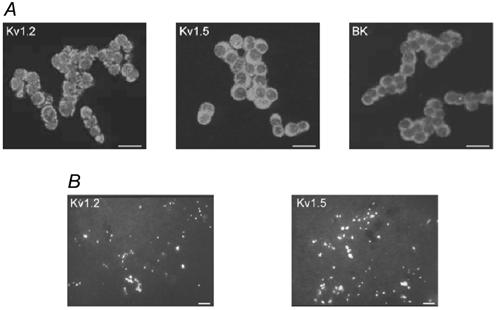
The regulation of K(+) channels by O(2) levels is a key link between hypoxia and neurotransmitter release in neuroendocrine cells. Here, we examined the effects of hypoxia on K(+) channels in the immortalised v-myc, adrenal-derived HNK1(+) (MAH) cell line. MAH cells possess a K(+) conductance that is sensitive to Cd(2+), iberiotoxin and apamin, and which is inhibited by ~24 % when exposed to a hypoxic perfusate (O(2) tension 20 mmHg). This conductance was attributed to high-conductance Ca(2+)-activated K(+) (BK) and small-conductance Ca(2+)-activated K(+) (SK) channels, which are major contributors to the O(2)-sensitive K(+) conductance in adrenomedullary chromaffin cells. Under low [Ca(2+)](i) conditions that prevented activation of Ca(2+)-dependent K(+) conductances, a rapidly activating and slowly inactivating K(+) conductance, sensitive to both TEA and 4-aminopyridine (4-AP), but insensitive to 100 nM charybdotoxin (CTX), was identified. This current was also reduced (by ~25 %) when exposed to hypoxia. The hypoxia-sensitive component of this current was greatly attenuated by 10 mM 4-AP, but was only slightly reduced by 10 mM TEA. This suggests the presence of delayed-rectifier O(2)-sensitive channels comprising homomultimeric Kv1.5 or heteromultimeric Kv1.5/Kv1.2 channel subunits. The presence of both Kv1.5 and Kv1.2 alpha-subunits was confirmed using immunocytochemical techniques. We also demonstrated that these K(+) channel subunits are present in neonatal rat adrenomedullary chromaffin cells in situ. These data indicate that MAH cells possess O(2)-sensitive K(+) channels with characteristics similar to those observed previously in isolated chromaffin cells, and therefore provide an excellent model for examining the cellular mechanisms of O(2) sensing in adrenomedullary chromaffin cells.


Figures

Figure 1
Figure 1. Ca2+-dependent K+ currents in adrenal-derived HNK1+ (MAH) cells
A, mean (± s.e.m.) current-voltage (I-V) relationship obtained using the perforated-patch voltage-clamp technique. Currents were evoked by 100 ms step depolarisations to a range of test potentials between -70 and +70 mV (10 mV increments; holding potential -60 mV) at a frequency of 0.1 Hz. Each point shows the mean (n = 19) current amplitude evoked by the step depolarisation. At more positive potentials, a marked shoulder in the I-V curve can be seen, indicative of the presence of a Ca2+-dependent K+ current. Inset, individual current traces from a typical cell, following depolarising steps to the test potentials indicated. B, individual traces evoked by single step depolarisations to +30 mV obtained under control conditions (c), following exposure to either 200 μm Cd2+ (Cd), 100 nm iberiotoxin (IbTx) or 100 nm apamin (a), and following washout (w).
Figure 2
Figure 2. Delayed-rectifier K+ currents in MAH cells identified under low free [Ca2+]i conditions
A, mean (± s.e.m.) I-V relationship obtained using the conventional whole-cell patch-clamp technique with [Ca2+]i clamped at ≈10 nm. Currents were evoked by 100 ms step depolarisations to a range of test potentials between -70 and +70 mV (10 mV increments; holding potential -60 mV) at a frequency of 0.1 Hz. Each point shows the mean (n = 14) current amplitude evoked by the step depolarisation. Inset, individual current traces from a typical cell following depolarising steps to the test potentials indicated. B, example time-series recording (typical of six such recordings) showing sustained outward current amplitudes observed when dialysed MAH cells were step depolarised to +30 mV for 100 ms (holding potential -60 mV) at a frequency of 0.1 Hz. The horizontal bar indicates the period of bath application of 200 μm Cd2+. Inset, individual current traces taken from the time series, before (c), during (Cd) and after (w) the bath application of Cd2+. C and D, time constants (τ) for activation (C) and inactivation (D) are plotted as a function of the test potential (V). Time constants were obtained by fitting activating and inactivating sections of current traces with a single exponential function. Data were averaged from 12 cells examined. E, steady-state activation is plotted as a function of the pre-pulse potential (Vpre-pulse). Data are means from 12 cells examined (error bars lie within data points and have been removed for clarity). The smooth curve represents a Boltzmann fit to activation data (see text). F, steady-state inactivation plotted as a function of Vpre-pulse. Channels failed to inactivate even at the highest test potentials examined, precluding fitting of the curve. Data are mean ± s.e.m. from 12 cells examined. Data in both E and F were normalised to the maximum evoked current. See Methods for details of voltage protocols and fitting procedures.
Figure 3
Figure 3. Concentration-dependent inhibition of Ca2+-independent, delayed-rectifier K+ currents in MAH cells by TEA and 4-aminopyridine (4-AP)
A, concentration-response curve for the inhibitory effect of TEA (0.01-300 mm) on delayed-rectifier K+ channel current. Each point shows the mean (± s.e.m.) inhibition taken from between four and six cells at each concentration. Data points were fitted with a sigmoidal curve. B, example time-series recording showing the inhibitory effects of different concentrations of TEA in a single cell. Each point shows the sustained current amplitude observed when repeatedly step depolarising to +30 mV for 100 ms (holding potential -60 mV) at a frequency of 0.1 Hz. Horizontal bars indicate the periods of bath application of 10, 100 and 300 mm TEA. C, as in A, except the curve shows the concentration-dependent inhibition due to 4-AP (0.01-30 mm). D, as in B, except the horizontal bars show the periods of bath application of 0.1, 1 and 10 mm 4-AP.
Figure 4
Figure 4. Effect of hypoxia on K+ currents and membrane potential in MAH cells
A, example ramp I-V relationships (typical of seven recordings) obtained from a single MAH cell before, during and after exposure to a hypoxic perfusate (O2 tension, PO2, 20 mmHg) using asymmetrical K+ (135 mm inside:5 mm outside) solutions in cells dialysed with a low free [Ca2+] pipette solution. Currents were evoked by a 1 s ramp depolarisation between -80 and +60 mV. B, example ramp I-V relationships using the same voltage protocol as in A, but obtained under symmetrical K+ (135 mm on either side of membrane) conditions. The magnitude of the O2-sensitive ‘difference’ current, obtained by subtracting current amplitudes in hypoxia from those obtained during normoxia, is indicated; note the reversal potential at 0 mV, as expected of a K+-selective channel. C, typical current-clamp (I = 0) recording obtained from a single MAH cell showing the depolarising effect of hypoxia on the cell membrane. The period of exposure to hypoxia (PO2 20 mmHg) is indicated by the horizontal bar. D, as in C except that the cell was exposed to 10 mm 4-AP prior to and during the exposure to hypoxia, as indicated by the horizontal bars; note that hypoxia had no additional effect on the depolarisation induced by 4-AP.
Figure 5
Figure 5. The O2-sensitive delayed-rectifier K+ current in MAH cells is sensitive to 4-AP and relatively insensitive to TEA
A, example time-series recording in which a single MAH cell was exposed to hypoxia (PO2 20 mmHg) under low [Ca2+]i conditions, prior to and during exposure to 10 mm 4-AP. Each point shows the sustained delayed-rectifier K+ current amplitude observed when the cell was repeatedly step depolarised to +30 mV for 100 ms (holding potential -60 mV) at a frequency of 0.1 Hz. Horizontal bars indicate the periods of exposure to hypoxia and 4-AP. Inset, individual traces taken from the time-series before (c) and during (h) exposure to hypoxia in the absence of 4-AP. B, taken from the same time-series recording as in A, except the portion of the time-series recorded during exposure to 10 mm 4-AP is shown on expanded time base to show more clearly that the effect of hypoxia was abolished in the presence of 4-AP. Inset, individual traces taken from the time-series before (c) and during (h) exposure to hypoxia in the presence of 4-AP. C, as in A, except that the cell was exposed to hypoxia prior to and during exposure to 10 mm TEA. Horizontal bars indicate the periods of exposure to hypoxia and TEA. Inset, individual traces taken from the time-series before (c) and during (h) exposure to hypoxia in the absence of TEA. D, as in B, except that the expanded time-series recording shows the effect of hypoxia in the presence of TEA on an expanded time base. Inset, individual traces taken from the time-series before (c) and during (h) exposure to hypoxia in the presence of TEA.
Figure 6
Figure 6. The delayed-rectifier, O2-sensitive K+ current in MAH cells is insensitive to charybdotoxin (CTX)
A, example time-series recording measuring the delayed-rectifier component of the K+ current in MAH cells and demonstrating the lack of effect of 100 nm CTX. Each point shows the sustained current amplitude observed when the cell was repeatedly step depolarised to +30 mV for 100 ms (holding potential -60 mV) at a frequency of 0.1 Hz, in the constant presence of 200 μm Cd2+. The lower horizontal bar indicates the period of exposure to CTX. The functionality of CTX was verified by examining the effects of the toxin on the Ca2+-dependent K+ current in MAH cells under normal [Ca2+]i conditions and in the absence of Cd2+ (B). In the presence of CTX and Cd2+, currents were inhibited by hypoxia (C), further demonstrating that the delayed-rectifier O2-sensitive K+ current in MAH cells is CTX insensitive.
Figure 7
Figure 7. O2 sensitivity of Ca2+-dependent K+ current in MAH cells
A, example time-series plot (typical of seven such recordings) demonstrating the inhibitory effect of hypoxia on the Ca2+-dependent K+ current in MAH cells, after block of the O2-sensitive delayed-rectifier K+ current with 10 mm 4-AP. Each point shows the sustained current amplitude observed when the cell was repeatedly step depolarised to +30 mV for 100 ms (holding potential -60 mV) at a frequency of 0.1 Hz. The horizontal bar indicates the period of exposure to hypoxia. B, as in A, except that the recording was made in the combined presence of 10 mm 4-AP and 200 μm Cd2+. This cell was previously demonstrated to be responsive to hypoxia (not shown).
Figure 8
Figure 8. Immunocytochemical evidence for the presence of O2-sensitive K+ channels in MAH cells and adrenal chromaffin cells in situ
A, confocal images showing the presence of the α-subunits of Kv1.2 and Kv1.5, and the high-conductance Ca2+-activated K+ (BK) channel, in MAH cells. Cells were immunostained with specific antibodies against the indicated channel, and visualised by Cy3 fluorescence coupled to the secondary antibody. Scale bars represent 20 μm. B, micrographs showing the presence of the α-subunits of Kv1.2 and Kv1, 5, in sections of adrenal glands obtained from 1- to 2-day-old rat pups. Sections were immunostained with specific antibodies against the indicated channel and visualised by Alexa488 fluorescence coupled to the secondary antibody; positive immunostaining for these subunits was confined to chromaffin cells. Scale bars represent 50 μm.

Similar articles

Cited by

References

    1. Barrett JN, Magleby KL, Pallotta BS. Properties of single calcium-activated potassium channels in cultured rat muscle. Journal of Physiology. 1982;331:211–230. - PMC - PubMed
    1. Beitner-Johnson D, Shull GE, Dedman JR, Millhorn DE. Regulation of gene expression by hypoxia: a molecular approach. Respiration Physiology. 1997;110:87–97. - PubMed
    1. Birren SJ, Anderson DJ. A v-myc-immortalized sympathoadrenal progenitor cell line in which neuronal differentiation is initiated by FGF but not NGF. Neuron. 1990;4:189–201. - PubMed
    1. Blatz AL, Magleby KL. Single apamin-blocked Ca-activated K+ channels of small conductance in cultured rat skeletal muscle. Nature. 1986;323:718–720. - PubMed
    1. Campbell AGM, Dawes GS, Fishman AP. Regional distribution of blood flow in the mature fetal lamb. Circulation Research. 1967;21:229–239. - PubMed

Publication types

LinkOut - more resources