. 2002 Dec 15;545(3):913-31.
doi: 10.1113/jphysiol.2002.027342.

Quantitative responses of spinothalamic lamina I neurones to graded mechanical stimulation in the cat

Affiliations

Quantitative responses of spinothalamic lamina I neurones to graded mechanical stimulation in the cat

David Andrew et al. J Physiol. .

Abstract

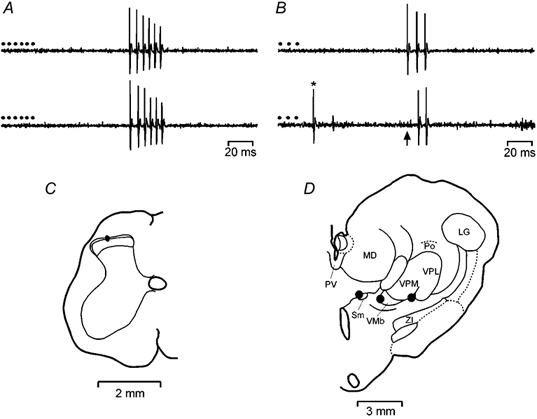
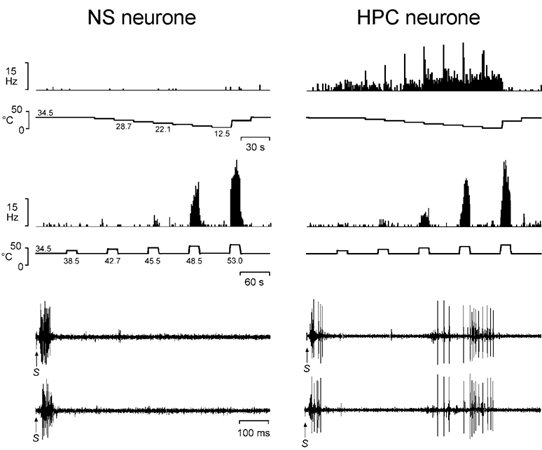
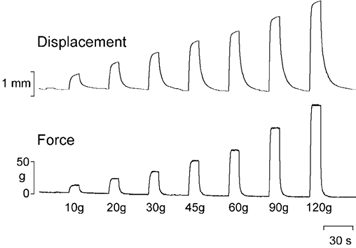
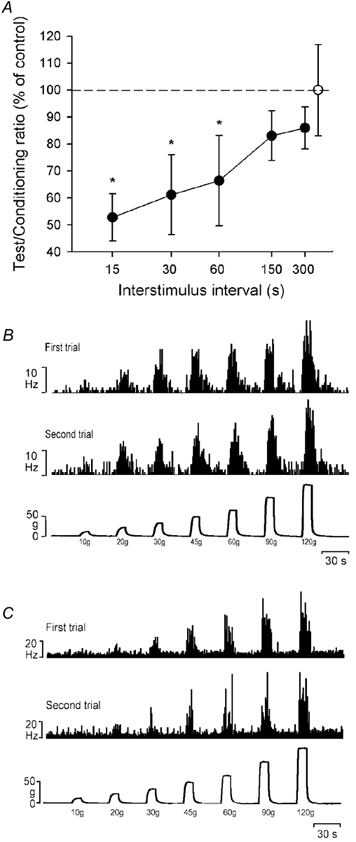
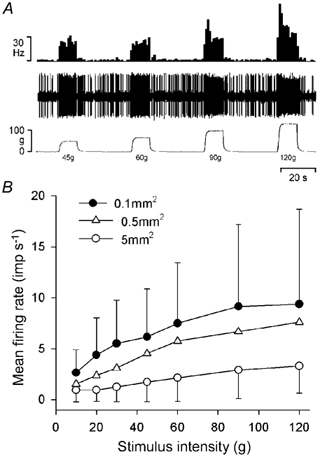
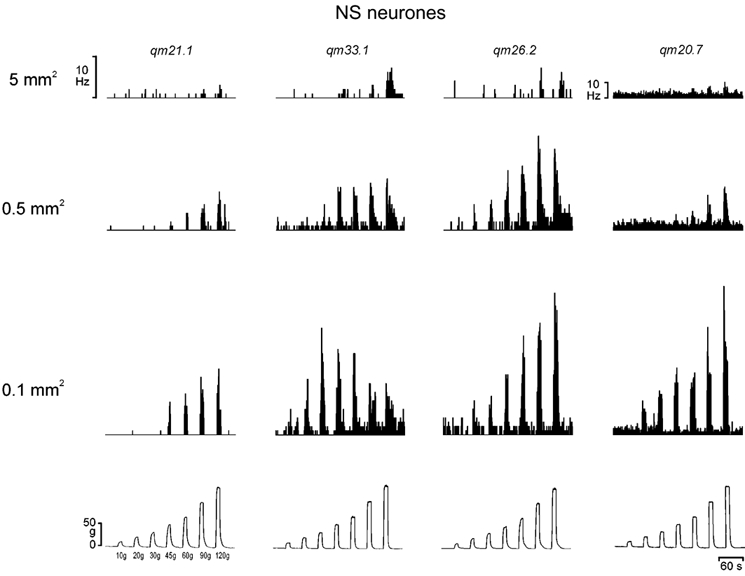
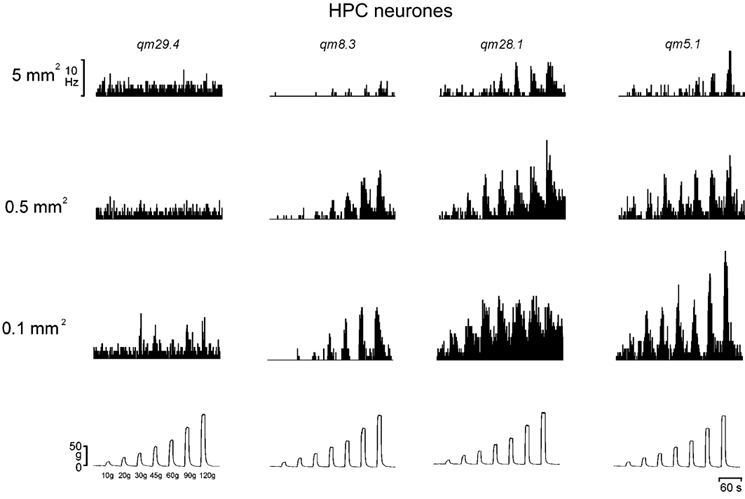
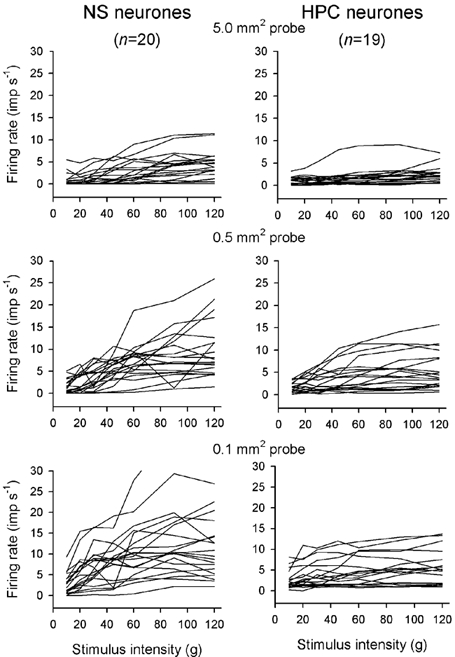
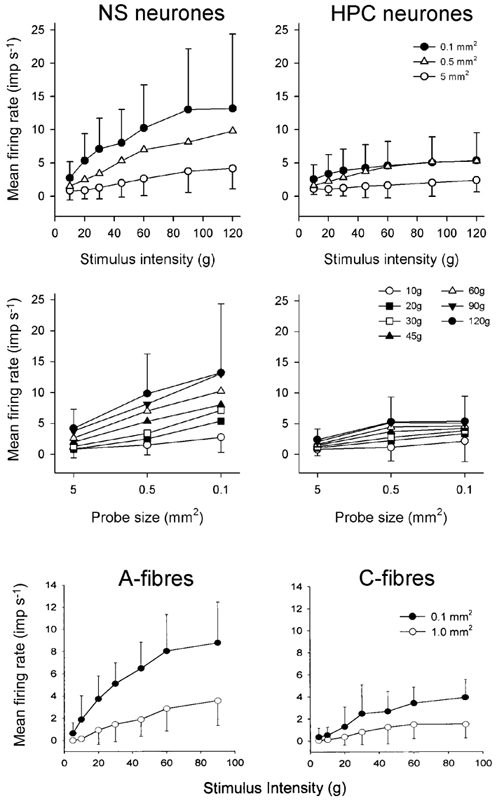
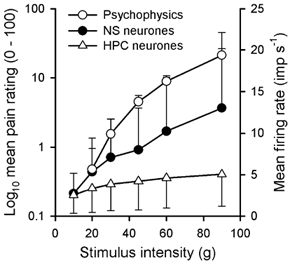
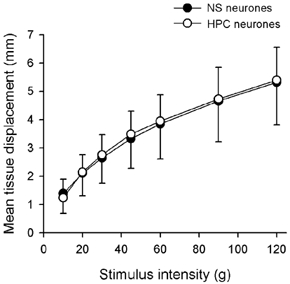
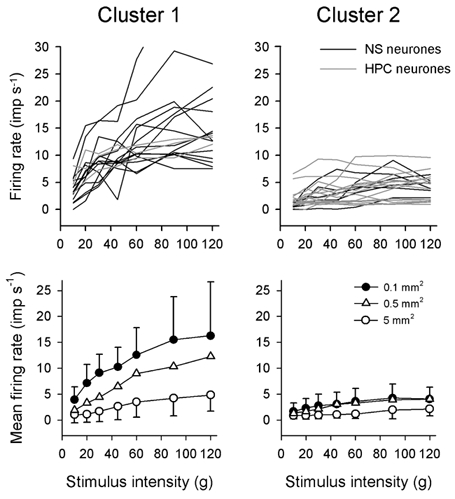
Nociceptive spinothalamic tract (STT) neurones in lamina I of the lumbosacral spinal cord of anaesthetized cats were characterized by recording their responses to graded mechanical stimulation with controlled forces of 10-120 g and probes of 5.0, 0.5 and 0.1 mm(2) contact area. Neurones were identified by antidromic activation from the contralateral thalamus, and cells that responded to noxious stimulation were categorized as either nociceptive specific (NS, n = 20) or as polymodal nociceptive (HPC, responsive to heat, pinch and cold, n = 19) based on their responses to quantitative thermal stimuli. The mean responses of the 39 units increased linearly as stimulus intensity increased, and the population stimulus-response curves evoked by each of the three probes were all significantly different from each other. Thresholds were 45 g for the 5.0 mm(2) probe, 30 g for the 0.5 mm(2) probe and 20 g for the 0.1 mm(2) probe. Further analysis showed that the NS neurones encoded both stimulus intensity and area (probe size) significantly better than HPC neurones in terms of their thresholds to individual probes, their peak discharge rates, their suprathreshold responsiveness and their ability to discriminate the three different probe sizes. These differences are consistent with the known differences between the mechanical encoding properties of A-fibre nociceptors, which provide the dominant inputs to NS neurones, and C-fibre nociceptors, which are the dominant inputs to HPC cells. Comparison of the stimulus-response curves of NS and HPC neurones indicated that the discharge of NS neurones better match the psychophysics of mechanical pain sensations in humans than the discharge of the HPC neurones do. Our findings support the view that NS neurones have a prominent role in mechanical pain and sharpness, and they corroborate the concept that the lamina I STT projection comprises several discrete channels that are integrated in the forebrain to generate qualitatively distinct sensations.


Figures

Figure 1
Figure 1. Identification of lamina I STT neurones
Representative responses from a single nociceptive-specific spinothalamic lamina I neurone. A, pair of records showing one-for-one following of a train of 6 antidromic shocks (•, 500 μA, 2 ms, 250 Hz) delivered from the stimulating electrode in the contralateral submedial nucleus. The conduction distance was 310 mm. Note the reduction in action potential amplitude that is characteristic of lamina I neurones at high discharge frequencies. B, collision of the first impulse in a train of 3 antidromic action potentials (150 Hz) due to an orthodromic impulse (*) occurring within the critical interval. The arrow indicates the point at which the first antidromic response would have occurred. C, location of the recording site of the neurone in lamina I of the L7 segment of the spinal cord. D, reconstruction of the contralateral thalamus showing the effective sites for antidromic activation (•). LG, lateral geniculate n.; MD, medial dorsal n.; Po, posterior n.; PV, paraventricular n.; Sm, submedial n.; VMb, basal part of the ventromedial n.; VPL, ventral posterior lateral n.; VPM, ventral posterior medial n.; ZI, zona incerta.
Figure 5
Figure 5. Differentiation of NS and HPC lamina I STT neurones
Representative histogrammed responses (1 s bins) from a single NS neurone and a single HPC neurone to stimulation of their receptive fields with graded cooling and graded heating stimuli. Also shown are the responses of the same cells to two bipolar intracutaneous electrical stimuli (1 mA, 1 ms) that were applied with a pair of needle electrodes inserted into the unit's innervation territory. Note the absence of C-fibre inputs to the NS neurone, and the robust, time-locked (monosynaptic) C-fibre inputs to the HPC neurone. S indicates the stimulus artefact. The peripheral conduction distances were 360 mm for both units.
Figure 2
Figure 2. Example of force and displacement during force-feedback controlled stimulation
Simultaneous records of applied force and probe displacement during the application of a typical series of force-feedback controlled stimuli. Note that the force was maintained during the stimuli, whereas probe displacement continued to increase due to the compliance of the underlying tissues.
Figure 3
Figure 3. Fatigue and response reproducibility in lamina I STT neurones during mechanical stimulation
A, population response of 6 neurones (3 NS, 3 HPC) to pairs of stimuli (60 g, 10 s applied with 0.1 mm2 probe) that were varied systematically with respect to the interstimulus interval. The open symbol (mean ± 1 s.d.) shows the variation in the normalized response to the conditioning (first) stimulus. Filled symbols (means ± 1 s.d.) show the response to the test (second) stimulus expressed as a percentage of the response to the conditioning stimulus plotted against the log of the interstimulus interval. *P < 0.05 when compared to the conditioning stimulus (Mann-Whitney U test). The dotted line indicates the baseline. B, histogrammed responses (1 s bins) of a single HPC lamina I STT neurone to force-feedback controlled mechanical stimuli applied with a probe of 0.1 mm2 contact area. Two trials of the same stimulus series that were separated by 15 min are shown. C, response of a single NS lamina I STT neurone to the same stimuli, but in this case the stimulus trials were separated by only 5 min.
Figure 4
Figure 4. Encoding of mechanical stimulus intensity and probe size by lamina I STT neurones
A, response of a single NS neurone to 4 constant-force mechanical stimuli applied with a 0.1 mm2 probe. The traces are, from the top downwards, the histogrammed discharge of the unit (1 s bins), the neural recording and the stimulus intensity. B, mean response of the population of lamina I STT neurones (n = 39) to graded mechanical stimulation (10-120 g) with probes of 5.0, 0.5 and 0.1 mm2 contact area. Symbols are means ± 1 s.d.
Figure 6
Figure 6. Encoding of mechanical stimulus intensity and probe size by NS neurones
The histogrammed responses (1 s bins) of 4 individual NS lamina I STT neurones to graded mechanical stimulation with 3 different sized probes, representing the variety of response patterns observed. The records in each column are from the same cell, and an example of a standard force record is shown at the bottom of each column. Note the size of the scale bar for unit qm20.7.
Figure 7
Figure 7. Encoding of mechanical stimulus intensity and probe size by HPC neurones
The histogrammed responses (1 s bins) of 4 individual HPC lamina I STT neurones to graded mechanical stimulation with 3 different sized probes, representing the variety of response patterns observed. The records in each column are from the same cell, and an example of a standard force record is shown at the bottom of each column.
Figure 8
Figure 8. Stimulus-response functions of NS and HPC neurones
The individual response functions of all 20 NS neurones and all 19 HPC neurones to graded mechanical stimulation with all 3 probe sizes. The response of 1 NS cell has been truncated vertically for clarity (bottom left).
Figure 9
Figure 9. NS neurones encode mechanical stimulus intensity and probe size better than HPC neurones
Mean population stimulus- response curves to graded mechanical stimulation (10-120 g) for NS (n = 20) and HPC (n = 19) neurones (top row). Three-factor, repeated measures ANOVA confirmed that NS neurones were more responsive than HPC neurones to mechanical stimulation (P < 0.02). The same data re-plotted with respect to probe size are shown in the middle row. For comparison, the stimulus-response curves of A- and C-fibre nociceptors to graded stimulation (10-90 g) with probes of 0.1 and 1.0 mm2 are shown (bottom row; reproduced from Andrew & Greenspan (1999) with permission).
Figure 10
Figure 10. The discharge of NS neurones better matches the psychophysics of mechanical pain than the discharge of HPC neurones
Mean population stimulus-response curves for NS (•) and HPC (▵) neurones evoked by the 0.1 mm2 probe. For comparison, the psychophysical pain judgments (○) reported by 12 human subjects evoked by brief (4 s), graded stimulation (5-90 g) with the same sized probe plotted on a log scale are also shown (adapted from Andrew & Greenspan (1999) with permission). Symbols are means ± 1 s.d. (•, ▵) and means ± 1 s.e.m. (○). The curves for the NS and HPC neurones have been truncated at 90 g.
Figure 11
Figure 11. Differences in the mechanical responsiveness of NS and HPC neurones are not due to systematic differences in the compliance of their receptive fields
Force-displacement plots for NS and HPC neurones recorded during characterizations with the 0.1 mm2 probe. Two-factor, repeated measures ANOVA confirmed that there was no significant difference between tissue compliance for the 2 groups of cells (P > 0.8).
Figure 12
Figure 12. Classification of nociceptive lamina I STT neurones based on their mechanical responsiveness
Individual (upper panel, 0.1 mm2 probe) and population (lower panel, all 3 probes) stimulus-response curves of the partitions identified by cluster analysis of responses to graded mechanical stimulation. The first cluster was composed of 14 NS neurones and 3 HPC neurones, and the second cluster was composed of 6 NS neurones and 16 HPC neurones (upper panel). The response of 1 NS cell in cluster 1 has been truncated vertically. Symbols are means ± 1 s.d.

References

    1. Adriansen H, Gybels J, Handwerker HO, Van Hees J. Nociceptor discharges and sensations due to prolonged noxious mechanical stimulation – a paradox. Human Neurobiology. 1984;3:53–58. - PubMed
    1. Andrew D, Craig AD. Spinothalamic lamina I neurons selectively sensitive to histamine: a central neural pathway for itch. Nature Neuroscience. 2001a;4:72–77. - PubMed
    1. Andrew D, Craig AD. Spinothalamic lamina I neurones selectively responsive to cutaneous warming in cats. Journal of Physiology. 2001b;537:489–495. - PMC - PubMed
    1. Andrew D, Craig AD. Responses of spinothalamic lamina I neurons to maintained noxious mechanical stimulation in the cat. Journal of Neurophysiology. 2002;87:1889–1901. - PubMed
    1. Andrew D, Greenspan JD. Peripheral coding of tonic mechanical cutaneous pain: Comparison of rat nociceptor discharge and human psychophysics. Journal of Neurophysiology. 1999;82:2641–2648. - PubMed

Publication types

LinkOut - more resources