. 2002 Dec 24;99(26):17125-30.
doi: 10.1073/pnas.012481899. Epub 2002 Dec 13.

Differential modulation of synaptic transmission by neuropeptide Y in rat neocortical neurons

Affiliations

Differential modulation of synaptic transmission by neuropeptide Y in rat neocortical neurons

Alberto Bacci et al. Proc Natl Acad Sci U S A. .

Abstract

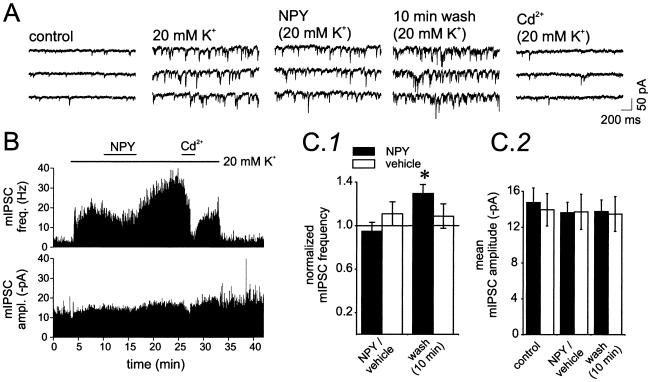
Neuropeptide Y (NPY) is widely expressed throughout the nervous system and is known to reduce excitatory (but also inhibitory) synaptic transmission in many CNS areas, leading to the proposal that it is an endogenous antiepileptic agent. In the neocortex, where NPY is present in gamma-aminobutyric acid (GABA)ergic interneurons, its effects on inhibitory and excitatory synaptic activities have not been completely explored. Here we report that NPY application elicits a long-lasting decrease in evoked excitatory postsynaptic current amplitude and a delayed, long-lasting increase in the amplitude of evoked monosynaptic inhibitory postsynaptic current (IPSC) in layer V pyramidal neurons of rat neocortex. The novel, late, NPY-mediated increase of inhibitory synaptic transmission is caused by modulation of Ca2+-dependent GABA release onto pyramidal neurons, as it was accompanied by an increase in Ca2+-dependent miniature IPSC frequency. NPY decreased evoked monosynaptic IPSCs in GABAergic interneurons, indicating that this neuropeptide has differential effects on different neuronal subtypes in the neocortex. Each of these NPY actions would decrease excitability in cortical circuits, a result that has important implications for both physiological neocortical operations as well as pathophysiological epileptiform activities.


Figures

Fig 1.
Fig 1.
Local NPY application causes delayed and long-lasting potentiation of IPSCs and long-lasting depression of EPSCs in pyramidal neurons. (A Left) Infrared videomicroscopic image of a pyramidal neuron soma and proximal dendrite. Patch electrode seen entering from right. (A Right) A depolarizing current pulse evokes an initial burst and a train of action potentials in the same cell. Injected current: 300 pA; 600 ms. (B) A 10-min NPY (1 μM) application to the neuron in A results in a delayed, long-lasting potentiation of the evoked IPSC amplitudes. (Upper) Averages of 10–15 IPSC traces in control, during NPY application, and at two time points during washout. (Lower) Time course of the increase in IPSC amplitude in the same cell. Each dot shows amplitude of a single IPSC. Series resistance was stable throughout the experiment (Lower). (C) Control application of ACSF to another cell elicited no change in IPSC amplitudes. (Upper) Averages of 10–15 IPSC traces at the indicated time points. (Lower) Time course of IPSC amplitude fluctuations, as in B. (D) Summary plot of IPSC amplitude vs. time in eight neurons exposed to NPY (○) and seven neurons exposed to the control ACSF (•). (E) AMPA receptor-mediated EPSCs are decreased by NPY application. Summary plot of nine NPY-treated (○) and six ACSF-treated (•) neurons. (Inset) Representative traces during control (1), NPY application (2), and 20 min of washout (3). [Bars (Inset) = 30 ms; 20 pA.] Each symbol in D and E represents normalized average of responses evoked at 0.1 Hz over 2 and 1 min, respectively.
Fig 2.
Fig 2.
mIPSCs recorded in 1 μM TTX are not affected by NPY treatment. (A) Representative traces of mIPSCs recorded in 1 μM TTX before (A1, control) and during (A2) NPY application and after 10 and 20 min of washout (A3 and A4). (B) mIPSC frequency and amplitudes were not affected by 1 μM NPY perfusion in the neuron of A. Symbols show average frequency (○) and amplitude (•) calculated in 30-sec bins. (C) Bar graphs of mIPSC frequency and amplitude from eight neurons. Changes during NPY application or wash were not significant.
Fig 3.
Fig 3.
mIPSCs recorded in 20 mM KCl are sensitive to NPY. (A) Representative traces of mIPSCs recorded in 1 μM TTX in normal ACSF (control, 2.5 mM K+), during extracellular perfusion of 20 mM K+, during NPY application (in 20 mM K+), after 10 min of NPY washout (in 20 mM K+), and during application of 200 μM Cd2+ (in 20 mM K+). (B) Time plot of mIPSC instantaneous frequency (Upper) and amplitude (Lower) in the neuron of A. (C) Bar graphs of mIPSC frequency (C1) and amplitude (C2) in NPY-treated neurons (solid bar; n = 6) and in neurons treated with 20 mM K+-containing ACSF without NPY (vehicle) (controls; open bars; n = 4). mIPSC frequency increased but only during NPY washout (P < 0.05). Vehicle treatment had no effect. (C2) mIPSC amplitudes were unaffected by either treatment.
Fig 4.
Fig 4.
NPY generates a long-lasting depression of evoked IPSCs on neocortical interneurons. (A Left) Infrared image of an interneuron indicated by adjacent patch electrode seen entering from the right. Note the round shape of cell body and the lack of the apical dendrite, in contrast to the adjacent large cell with a pyramidal shape and a thick apical dendrite. (A Right) In the same cell, a depolarizing current pulse evokes typical FS behavior. Current pulses: −300 and 300 pA, 600 ms. (B Upper) Averages of 10–15 IPSC traces in control, during NPY application and at two time points during washout. (Lower) Time course of IPSC amplitudes in the same cell and a plot of series resistance over the same time period. Each symbol in B shows the amplitude of a single IPSC (•) and normalized values for series resistance (Rs) over time (○). (C) Summary plot of normalized IPSC amplitude vs. time in nine interneurons exposed to NPY (○) and five interneurons exposed to the control ACSF (•). Horizontal bar: NPY perfusion. Each symbol shows normalized IPSC amplitude averaged over 2 min.

Similar articles

Cited by

References

    1. Wahlestedt C. & Reis, D. J. (1993) Annu. Rev. Pharmacol. Toxicol. 33, 309-352. - PubMed
    1. Balasubramaniam A. A. (1997) Peptides 18, 445-457. - PubMed
    1. Blomqvist A. G. & Herzog, H. (1997) Trends Neurosci. 20, 294-298. - PubMed
    1. Michel M. C., Beck-Sickinger, A., Cox, H., Doods, H. N., Herzog, H., Larhammar, D., Quirion, R., Schwartz, T. & Westfall, T. (1998) Pharmacol. Rev. 50, 143-150. - PubMed
    1. Hendry S. H., Jones, E. G., De Felipe, J., Schmechel, D., Brandon, C. & Emson, P. C. (1984) Proc. Natl. Acad. Sci. USA 81, 6526-6530. - PMC - PubMed

Publication types

LinkOut - more resources