. 2002 Dec 16;21(24):6709-20.
doi: 10.1093/emboj/cdf666.

Adaptation to Fe-deficiency requires remodeling of the photosynthetic apparatus

Affiliations

Adaptation to Fe-deficiency requires remodeling of the photosynthetic apparatus

Jeffrey L Moseley et al. EMBO J. .

Abstract

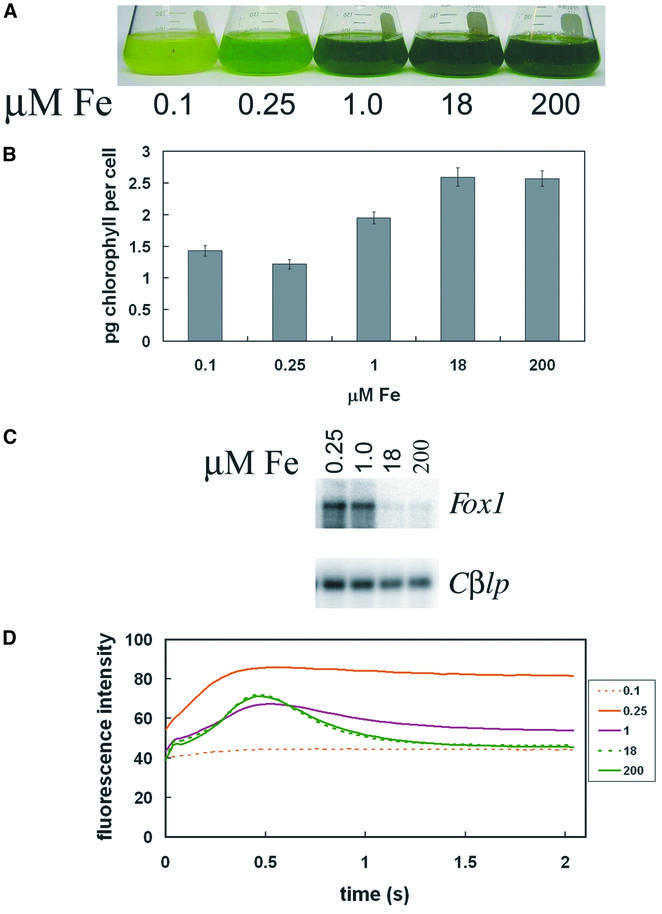
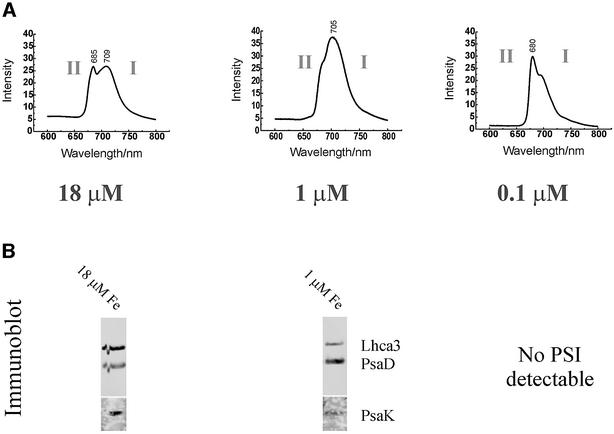
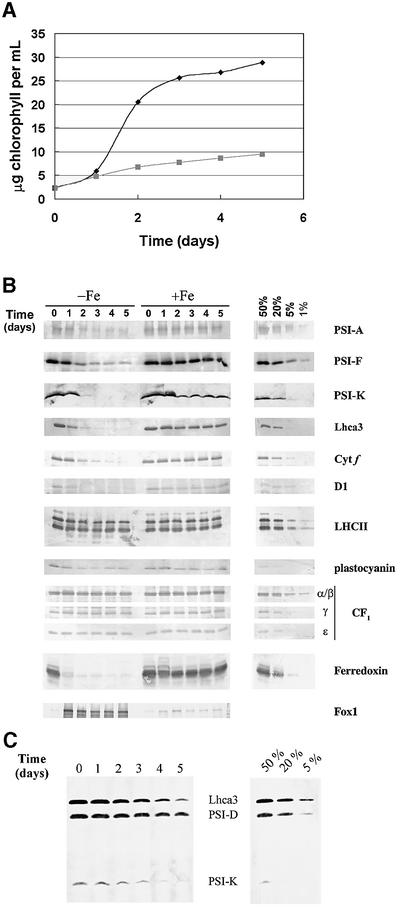
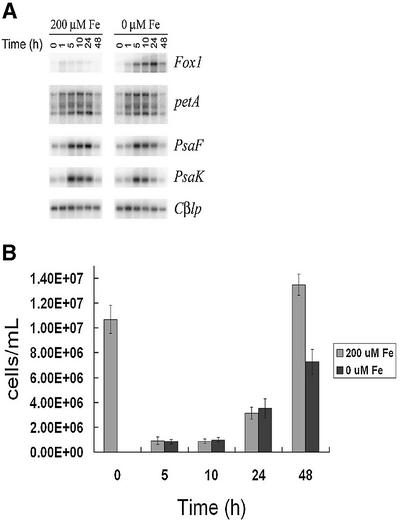
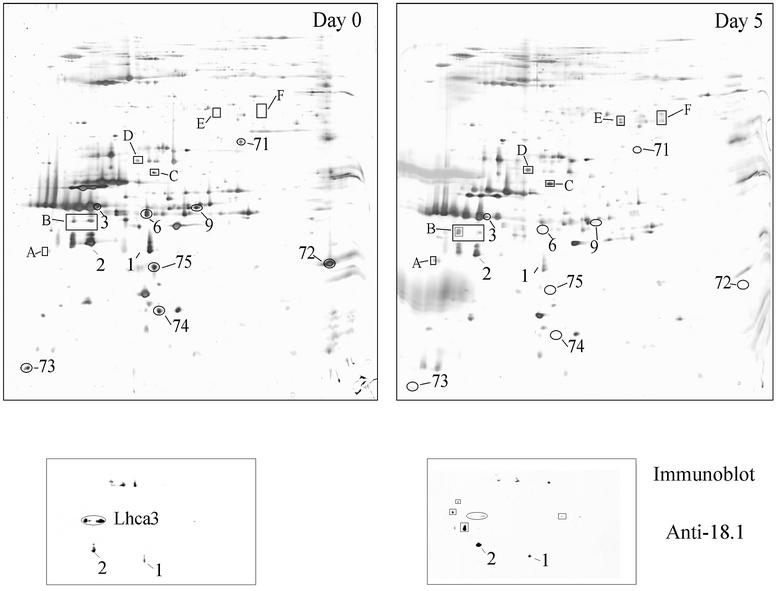
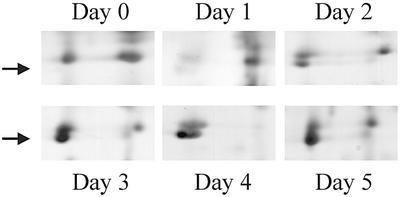
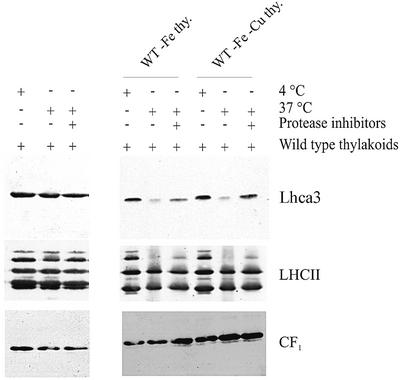
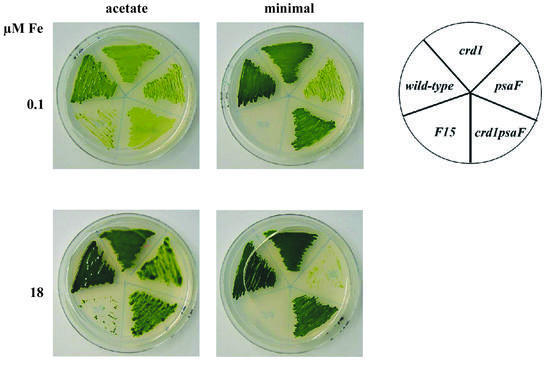
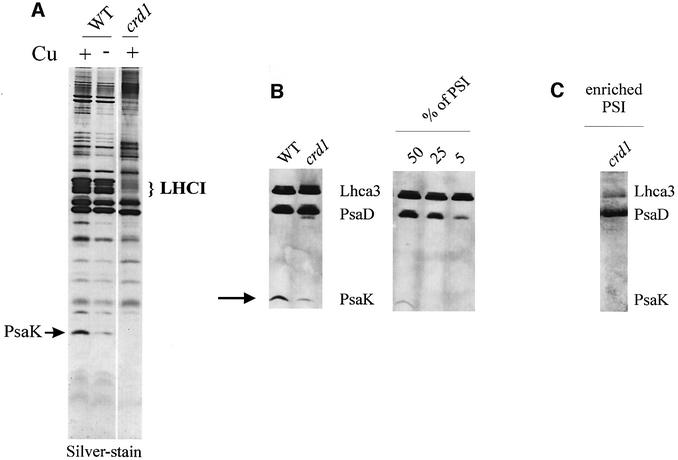
The molecular mechanisms underlying the onset of Fe-deficiency chlorosis and the maintenance of photosynthetic function in chlorotic chloroplasts are relevant to global photosynthetic productivity. We describe a series of graded responses of the photosynthetic apparatus to Fe-deficiency, including a novel response that occurs prior to the onset of chlorosis, namely the disconnection of the LHCI antenna from photosystem I (PSI). We propose that disconnection is mediated by a change in the physical properties of PSI-K in PSI in response to a change in plastid Fe content, which is sensed through the occupancy, and hence activity, of the Fe-containing active site in Crd1. We show further that progression of the response involves remodeling of the antenna complexes-specific degradation of existing proteins coupled to the synthesis of new ones, and establishment of a new steady state with decreased stoichiometry of electron transfer complexes. We suggest that these responses are typical of a dynamic photosynthetic apparatus where photosynthetic function is optimized and photooxidative damage is minimized in graduated responses to a combination of nutrients, light quantity and quality.


Figures

None
Fig. 1. (A) Wild-type (CC124) Chlamydomonas cultures grown in TAP medium containing 0.1, 0.25, 1, 18 and 200 µM of Fe, supplied as an Fe·EDTA chelate. Cultures were grown at 24°C for 3 days, with 50 µE m–2s–1 of constant light. (B) Estimated chlorophyll content in picograms (pg) from cells grown with the indicated concentrations of Fe. (C) RNA blot analysis of Fox1 (encoding ferroxidase) expression in wild-type (CC124) cells grown with the indicated concentrations of Fe. The abundance of Cβlp RNA is monitored to demonstrate similar loading. (D) Fluorescence induction and decay kinetics from cells grown with various Fe concentrations (green solid line, 200 µM Fe; green dashed line, 18 µM Fe; purple line, 1 µM Fe; orange solid line, 0.25 µM Fe; orange dashed line, 0.1 µM Fe). Fluorescence intensity is indicated in arbitrary units.
None
Fig. 2. (A) Low-temperature (77 K) fluorescence analysis of thylakoid membranes from wild-type cells grown with 18, 1 and 0.1 µM Fe. Fluorescence intensity is indicated in arbitrary units. The wavelengths (in nm) of the fluorescence peaks are indicated above the curves. Roman numerals I and II illustrate the designation of the peaks to fluorescence from PSI/LHCI and PSII/LHCII, respectively. (B) Immunodetection of the PSI subunits PSI-D and PSI-K, and the LHCI outer antenna subunit Lhca3 in enriched PSI/LHCI particles from cells grown with the indicated concentrations of Fe. Samples were loaded on the basis of equal protein.
None
Fig. 3. (A) Chlorophyll concentration of wild-type (CC124) cultures grown in TAP medium with 200 µM Fe (black line) or without Fe (gray line). Both cultures were inoculated to the same initial density (1 × 10⁶ cells/ml) from a culture containing 200 µM Fe. (B) Immunoblot analysis of total-cell extracts from Fe-depleted versus Fe-supplemented cells to compare the abundance of selected photosynthetic and marker proteins. Samples were normalized to contain equal amounts of ATP synthase. (C) Immunodetection of PSI-D, PSI-K and Lhca3 in thylakoid membranes prepared from cells during 5 days of Fe-depletion. Equal amounts of protein are added in each lane. The sample from day 0 was diluted (right hand panel) to generate a calibration curve for estimating the degree of change during the time-courses in (B) and (C).
None
Fig. 4. (A) RNA blot analysis to compare Fox1, PsaF, PsaK and petA gene expression during growth in Fe-deficient versus Fe-replete medium. (B) Growth of the Fe-replete (200 µM Fe, light-gray bars) and Fe-depleted (no added Fe, dark-gray bars) cultures at the time points from which the RNA was prepared. Both cultures were inoculated to the same initial cell density (∼1 × 10⁶ cells/ml) from a starter culture containing 200 µM Fe.
None
Fig. 5. (A) The top two panels (0 day and 5 day) represent silver-stained 2-D gels of thylakoid membranes from wild-type cells before and after 5 days of growth in Fe-deficient (0 µM Fe) medium, respectively. The labeled spots have been identified previously as follows: spots 1 and 2 correspond to the inner LHCI subunits Lhca1 and presumably Lhca4, respectively, while the labeled spots correspond to isoforms of Lhca3. (B) Immunodetection of LHCI subunits in thylakoid membranes separated by 2-DE as shown in (A), using an anti-serum (18.1; Bassi et al., 1992) which recognizes epitopes that are common to most of the LHCI subunits.
None
Fig. 6. Evolution of the new putative LHCI protein spot in box B during adaptation to Fe deficiency (Figure 5). Enlarged box B from silver-stained 2-DE gels of thylakoid membranes from wild-type cells before and after 1–5 days of growth in Fe-deficient (0 µM Fe) medium.
None
Fig. 7. Immunoblots showing the susceptibility of Lhca3 and components of the major trimeric complex of LHCII in wild-type thylakoids to proteolysis when mixed with thylakoids from Fe-deficient or Fe- and Cu-deficient cells. Chloroplast ATPase accumulation (CF1) is shown to demonstrate equal loading and specificity of the proteolytic activity. Incubation of the thylakoids at 4°C or 37°C, with or without protease inhibitor is indicated (protease inhibitor cocktail set II; Calbiochem).
None
Fig. 8. Comparison of the growth of wild-type, psaF, crd1, crd1psaF and F15 strains on TAP versus minimal medium, for 10 days at 25°C, with a light intensity of ∼150 µE m–2s–1.
None
Fig. 9. (A) Silver-stained gel (Schägger and von Jagow, 1987) of enriched PSI/LHCI particles from +Cu (6 µM Cu) and –Cu (0 µM added Cu) wild-type and +Cu crd1 mutant cells. The migration of the PSI-K subunit is indicated with an arrow. (B) Immunoblot analysis to compare the abundance of PSI-D, Lhca3 and PSI-K in thylakoid membranes from wild-type and crd1 cells grown in TAP medium with normal Fe and Cu. The migration of PSI-K is indicated with an arrow. To determine the amount of PSI-K that is still present with the crd1 thylakoids, we performed in parallel dilution series where the total amount of thylakoid membrane protein loaded remained the same but the amount of PSI was diminished by mixing wild-type thylakoids with thylakoids isolated from a PSI-deficient mutant. The corresponding immunoblot shows that PSI-D and PSI-K signals vanish as the amount of PSI decreases. From this experiment, we can estimate that the amount of PSI-K in crd1 thylakoids is diminished to ∼50% of the quantity found in wild type. (C) Immunodetection of PSI-D, Lhca3 and PSI-K in enriched PSI/LHCI particles from +Cu crd1 cells.

Similar articles

Cited by

References

    1. Bassi R., Soen,S.Y., Frank,G., Zuber,H. and Rochaix,J.D. (1992) Characterization of chlorophyll a/b proteins of photosystem I from Chlamydomonas reinhardtii. J. Biol. Chem., 267, 25714–25721. - PubMed
    1. Bennoun P. and Delepelaire,P. (1982) Isolation of photosynthesis mutants in Chlamydomonas. In Edelman,M., Hallick,R.B. and Chua,N.-H. (eds), Methods in Chloroplast Molecular Biology. Elsevier Biomedical Press, Amsterdam, The Netherlands, pp. 25–38.
    1. Bibby T.S., Nield,J. and Barber,J. (2001) Iron deficiency induces the formation of an antenna ring around trimeric photosystem I in cyanobacteria. Nature, 412, 743–745. - PubMed
    1. Boekema E.J., Hifney,A., Yakushevska,A.E., Piotrowski,M., Keegstra,W., Berry,S., Michel,K.P., Pistorius,E.K. and Kruip,J. (2001) A giant chlorophyll–protein complex induced by iron deficiency in cyanobacteria. Nature, 412, 745–748. - PubMed
    1. Burnap R.L., Troyan,T. and Sherman,L.A. (1993) The highly abundant chlorophyll–protein complex of iron-deficient Synechococcus sp. PCC7942 (CP43′) is encoded by the isiA gene. Plant Physiol., 103, 893–902. - PMC - PubMed

Publication types

MeSH terms