. 2002 Dec 16;21(24):6820-31.
doi: 10.1093/emboj/cdf682.

In vivo destabilization of dynamic microtubules by HDAC6-mediated deacetylation

Affiliations

In vivo destabilization of dynamic microtubules by HDAC6-mediated deacetylation

Akihisa Matsuyama et al. EMBO J. .

Abstract

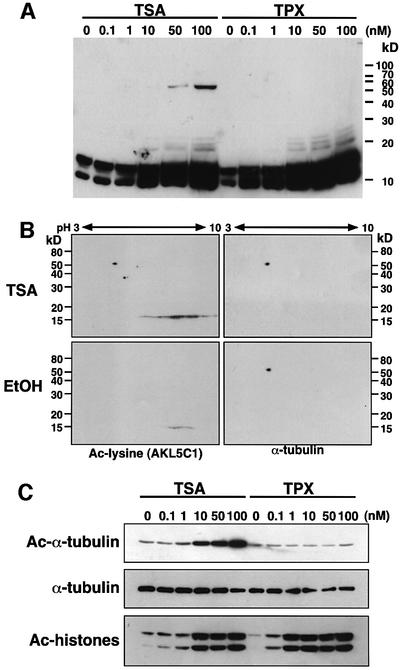
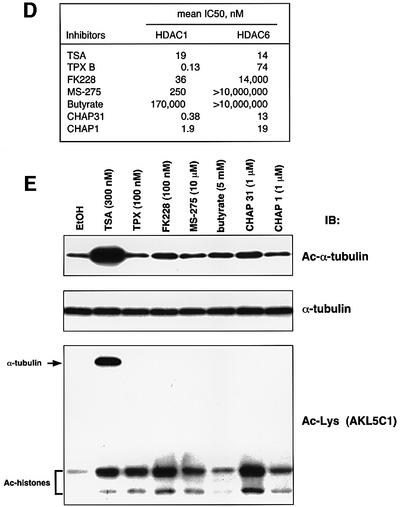
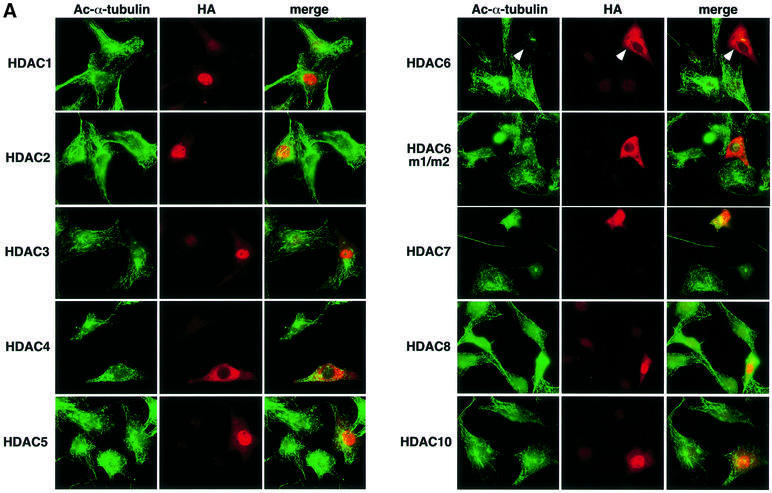
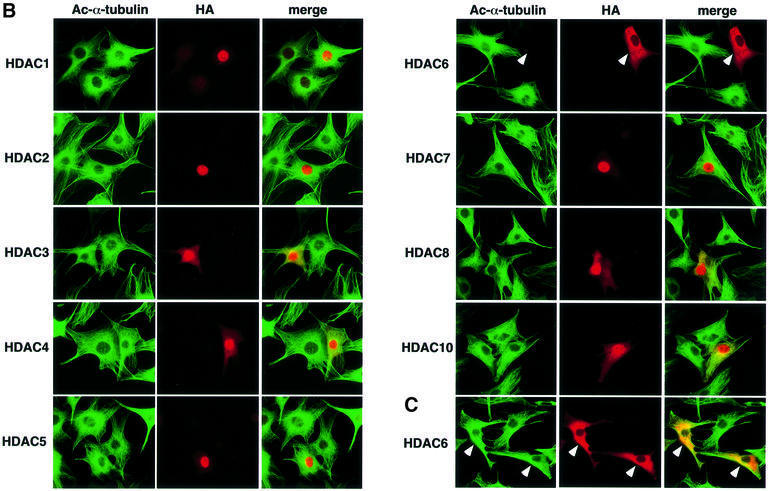
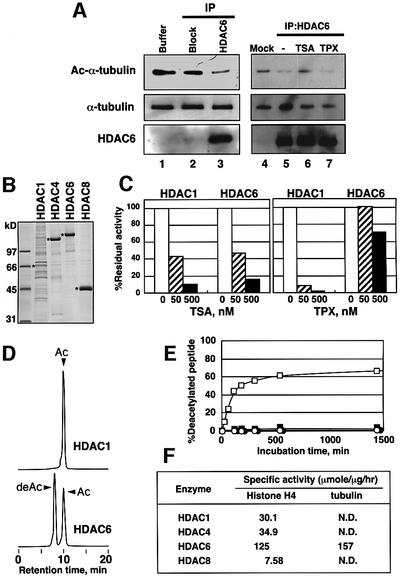
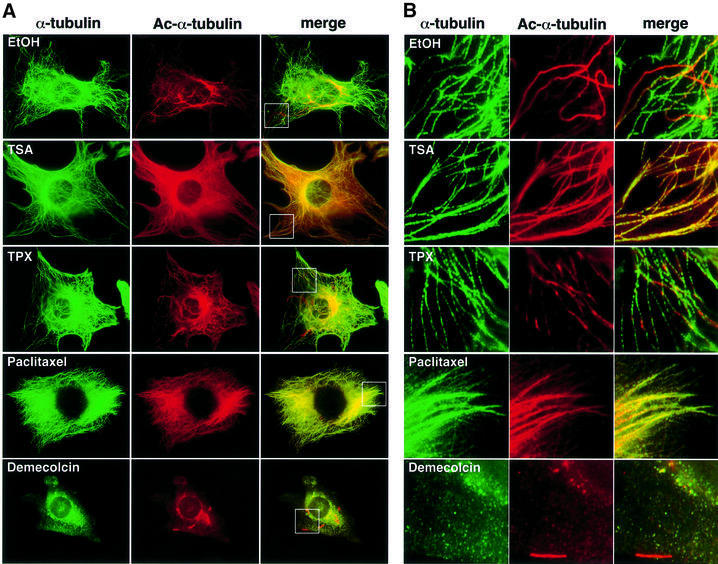
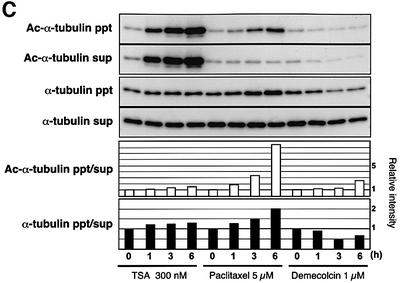
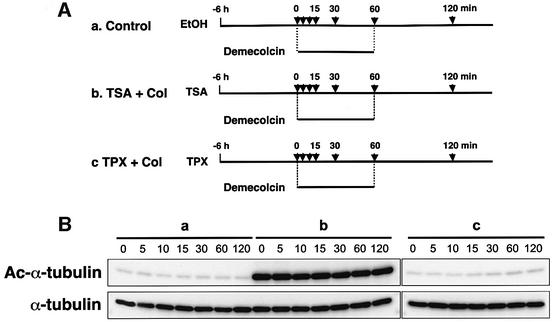
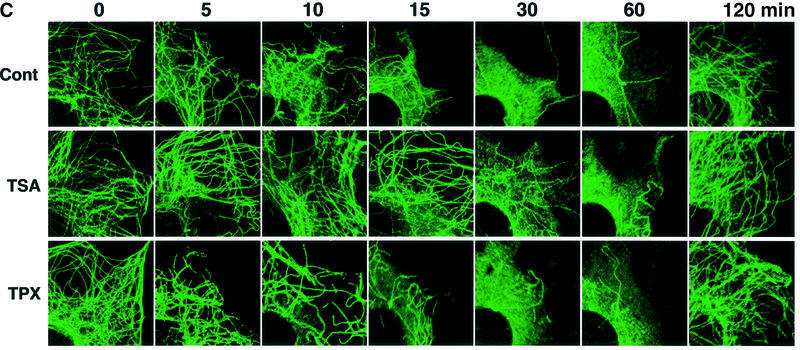
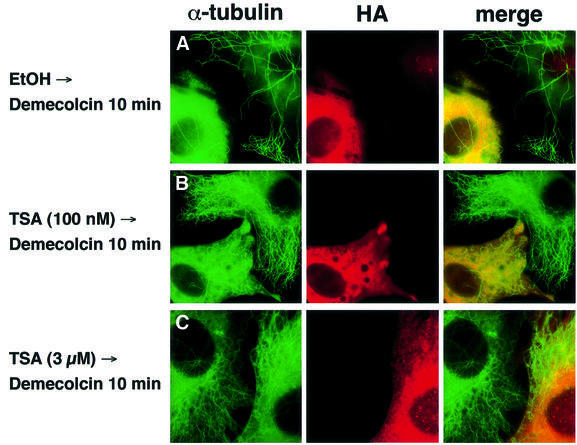
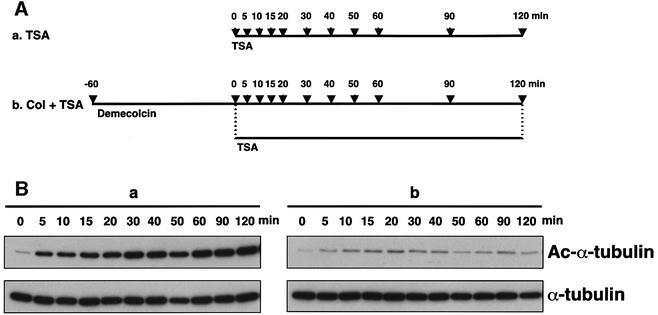
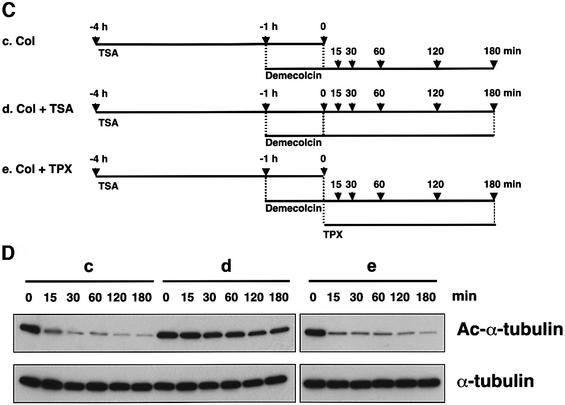
Trichostatin A (TSA) inhibits all histone deacetylases (HDACs) of both class I and II, whereas trapoxin (TPX) cannot inhibit HDAC6, a cytoplasmic member of class II HDACs. We took advantage of this differential sensitivity of HDAC6 to TSA and TPX to identify its substrates. Using this approach, alpha-tubulin was identified as an HDAC6 substrate. HDAC6 deacetylated alpha-tubulin both in vivo and in vitro. Our investigations suggest that HDAC6 controls the stability of a dynamic pool of microtubules. Indeed, we found that highly acetylated microtubules observed after TSA treatment exhibited delayed drug-induced depolymerization and that HDAC6 overexpression prompted their induced depolymerization. Depolymerized tubulin was rapidly deacetylated in vivo, whereas tubulin acetylation occurred only after polymerization. We therefore suggest that acetylation and deacetylation are coupled to the microtubule turnover and that HDAC6 plays a key regulatory role in the stability of the dynamic microtubules.


Figures

None
Fig. 1. Acetylation of α-tubulin induced by TSA. (A) A protein with an apparent molecular mass of 54 kDa was strongly acetylated in response to TSA. NIH 3T3 cells were treated with various concentrations of either TSA or TPX B for 6 h. Acetylated proteins were analyzed by immunoblotting using an anti-acetylated lysine antibody (clone AKL5C1). (B) Identification of p54 as α-tubulin. Cell lysates prepared from NIH 3T3 cells that had been treated with either TSA (upper) or EtOH (lower) were subjected to two-dimensional PAGE and immunoblotted with an anti-acetylated lysine antibody (AKL5C1; left). The same blots were reprobed with an anti-α-tubulin antibody (clone B-5-1-2; right). (C) Acetylation of Lys40 in α-tubulin in TSA-treated cells. Cell lysates used in (A) were immunoblotted with anti-acetylated α-tubulin (clone 6-11B-1), anti-α-tubulin (B-5-1-2) or anti-acetylated lysine antibodies (AKL5C1). Note that TPX effectively enhanced the acetylated level of histones but not of α-tubulin. (D) Inhibitory potency of HDAC inhibitors against HDAC1 and HDAC6. The 50% inhibitory concentration (IC50) of each inhibitor was determined as described previously (Furumai et al., 2001). (E) Correlation between the ability of HDAC inhibitors to inhibit HDAC6 and to induce in vivo α-tubulin acetylation. NIH 3T3 cells were cultured for 6 h with each inhibitor at a concentration sufficient to induce histone acetylation, and then the levels of acetylation of the α-tubulin (Ac-α-tubulin), the total α-tubulin (α-tubulin) and acetylated proteins (Ac-Lys) were determined by immunoblotting.
None
Fig. 2. In vivo deacetylation of α-tubulin by HDAC6. (A) Effects of HDAC expression on tubulin acetylation in individual cells. NIH 3T3 cells grown on coverslips were transfected with HA-HDACs. After fixation, cells were immunostained with anti-acetylated α-tubulin and anti-HA antibodies. The cells transfected with HDAC6 are indicated by arrowheads. (B) Effects of HDAC expression on tubulin acetylation in TSA-treated cells. NIH 3T3 cells grown on coverslips were transfected with HA-HDACs and then treated with 100 nM TSA for 6 h. The cells transfected with HDAC6 are indicated by arrowheads. (C) Inhibition of the HDAC6-mediated tubulin deacetylation by a high concentration of TSA. NIH 3T3 cells grown on coverslips were transfected with HA-HDAC6 and then treated with 3 µM TSA for 6 h. The cells transfected with HDAC6 are indicated by arrowheads.
None
Fig. 3. In vitro deacetylation of α-tubulin by HDAC6. (A) Deacetylation of acetylated microtubules by HDAC6 from mouse testis. HDAC6 was isolated from mouse testis by immunoprecipitation using an anti-mouse HDAC6 antibody raised against an HDAC6 peptide (Verdel et al., 2000). As a control, the antigen peptide was added in excess to block the antibody binding to HDAC6 (Block). HDAC6 was incubated with acetylated microtubules isolated from TSA-treated cells in 20 µl for 3 h at 37°C in the presence or absence of TSA (100 nM) or TPX (100 nM). The success of the immunoprecipitation and the deacetylation of the microtubules were visualized by immunoblotting using the anti-mouse HDAC6 and anti-acetylated tubulin antibodies, respectively. (B) Purification of HDAC enzymes produced in insect cells via a baculovirus system. Asterisks denote the produced enzymes in the CBB stained gel of SDS–PAGE. HDAC4, HDAC6 and HDAC8 were efficiently expressed and highly purified. Although the production of HDAC1 was not efficient, the preparation had a sufficient activity to deacetylate 3H-histone. (C) Effects of TSA and TPX on the recombinant enzymes. The enzyme activities of HDAC1 and HDAC6 were determined with 3H-histone in the presence of various concentrations of TSA and TPX. (DIn vitro deacetylation of an acetylated tubulin peptide by recombinant human HDAC6. Recombinant human HDAC6 was incubated for 3 h with 0.5 mM Dns-tubulin peptide containing acetylated Lys40, and the reaction mixtures were analyzed with HPLC using a fluorescent detector. The retention time of the new peak (deAc) was identical to that of Dns-tubulin peptide without acetylation. (E) Enzyme specificity of deacetylation. The deacetylation of the Dns-acetylated tubulin peptide was analyzed over time with recombinant HDAC1, HDAC4, HDAC6 and HDAC8. The enzyme preparations used for the deacetylation assay were normalized based on their specific activities obtained with 3H-histone. The amounts of the deacetylated peptide after incubation with HDAC1 (open circles), HDAC4 (filled circles), HDAC6 (open squares) and HDAC8 (filled squares) for various lengths of time were plotted. (F) Specific activities of the recombinant enzymes for deacetylation of tubulin and histone H4 peptides. N.D., not detected.
None
Fig. 4. Effect of TSA on microtubule morphology. (A) Immunostaining of cells treated with TSA, TPX, paclitaxel and demecolcin. NIH 3T3 cells were treated with the various drugs for 6 h. The cells were fixed and stained for tyrosinated α-tubulin (α-tubulin) and acetylated α-tubulin (Ac-α-tubulin). (B) Microtubule morphology in the cell edge region. The boxed regions in (A) were viewed at higher magnification. (C) NIH 3T3 cells were treated with either TSA, paclitaxel or demecolcin for the indicated time and lysed. Total cell lysates from the drug-treated cultures were separated into the precipitates and supernatants by 16 000 g centrifugation. The fractions were immunoblotted with anti-acetylated α-tubulin (upper two panels) and anti-α-tubulin (middle two panels) antibodies. The band intensities were measured using densitometry, and the precipitate/supernatant ratios were determined (lower two panels).
None
Fig. 5. Delayed depolymerization of microtubules in TSA-treated cells. (A) Schematic representation of experimental procedures. Bars indicate the periods during which the cells were treated with drugs. Arrows indicate the time-points at which cells were taken for immunoblot analysis (B) and immunofluorescent microscopy (C). (B) Cellular levels of tubulin acetylation in the time-course experiments. The amounts of acetylated and total tubulin in the cells treated with various drugs in the time-course experiments designed in (A) were determined by immunoblotting with anti-acetylated α-tubulin (upper) and anti-α-tubulin (lower) antibodies. (C) Depolymerization and repolymerization during demecolcin treatment and removal. Microtubules were visualized by immunofluorescent staining with the anti-α-tubulin antibody. The microscopic images were taken at the time-points indicated in (A).
None
Fig. 6. Enhanced depolymerization of microtubules in HDAC6-overexpressing cells. NIH 3T3 cells transfected with an HA-HDAC6 expression vector were pretreated with ethanol (A), 100 nM TSA (B) and 3 µM TSA (C) for 6 h and then exposed to demecolcin for 10 min. Microtubules were stained with the anti-α-tubulin antibody and the HDAC6-transfected cells were visualized with the anti-HA antibody.
None
Fig. 7. Acetylation dependent on tubulin polymerization. (A) Schematic representation of experimental procedures for tubulin acetylation. Bars indicate the periods during which cells were treated with the drugs. Arrows indicate the time-points at which cells were taken for immunoblot analysis (B). (B) Effect of demecolcin pretreatment on TSA-induced tubulin acetylation. The amounts of acetylated and total tubulin in the cells in the time-course experiments designed as in (A) were determined by immunoblotting with anti-acetylated α-tubulin (upper) and anti-α-tubulin (lower) antibodies. (C) Schematic representation of experimental procedures for tubulin deacetylation. Bars indicate the periods during which the cells were treated with drugs. Arrows indicate the time-points at which cells were taken for immunoblot analysis (D). (D) Deacetylation of depolymerized tubulin. The amounts of acetylated and total tubulin in the cells treated with various drugs in the time-course experiments designed as in (C) were determined by immunoblotting with anti-acetylated α-tubulin (upper) and anti-α-tubulin (lower) antibodies.

References

    1. Bannister A.J., Miska,E.A., Görlich,D. and Kouzarides,T. (2000) Acetylation of importin-α nuclear import factors by CBP/p300. Curr. Biol., 10, 467–470. - PubMed
    1. Billger M., Stromberg,E. and Wallin,M. (1991) Microtubule-associated proteins-dependent colchicine stability of acetylated cold-labile brain microtubules from the Atlantic cod, Gadus morhua. J. Cell Biol., 113, 331–338. - PMC - PubMed
    1. Black M.M., Baas,P.W. and Humphries,S. (1989) Dynamics of α-tubulin deacetylation in intact neurons. J. Neurosci., 9, 358–368. - PMC - PubMed
    1. Cheung P., Allis,C.D. and Sassone-Corsi,P. (2000) Signaling to chromatin through histone modifications. Cell, 103, 263–271. - PubMed
    1. Furumai R., Komatsu,Y., Nishino,N., Khochbin,S., Yoshida,M. and Horinouchi,S. (2001) Potent histone deacetylase inhibitors built from trichostatin A and cyclic tetrapeptide antibiotics including trapoxin. Proc. Natl Acad. Sci. USA, 98, 87–92. - PMC - PubMed

Publication types