. 2003 Jan;185(1):262-73.
doi: 10.1128/JB.185.1.262-273.2003.

Residue R113 is essential for PhoP dimerization and function: a residue buried in the asymmetric PhoP dimer interface determined in the PhoPN three-dimensional crystal structure

Affiliations

Residue R113 is essential for PhoP dimerization and function: a residue buried in the asymmetric PhoP dimer interface determined in the PhoPN three-dimensional crystal structure

Yinghua Chen et al. J Bacteriol. 2003 Jan.

Abstract

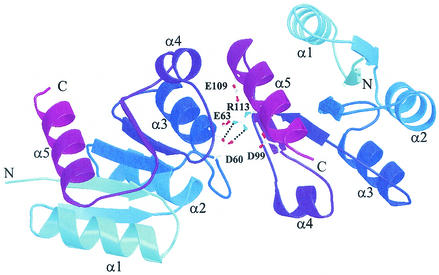
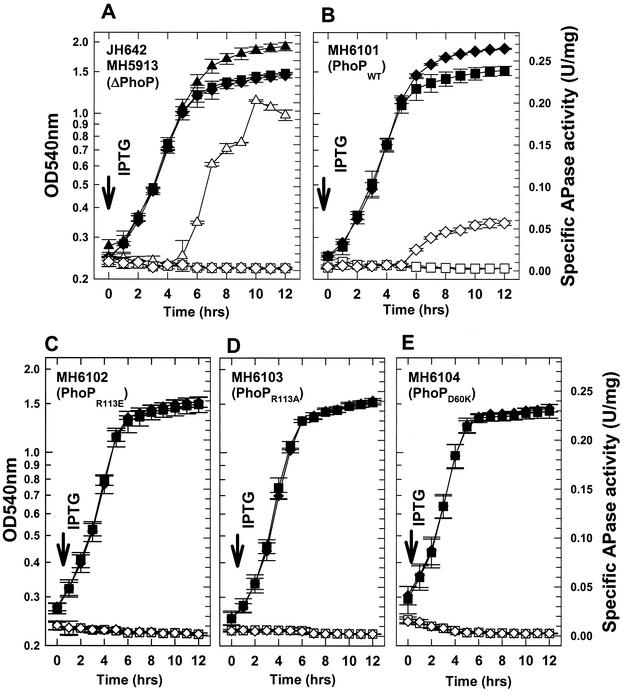
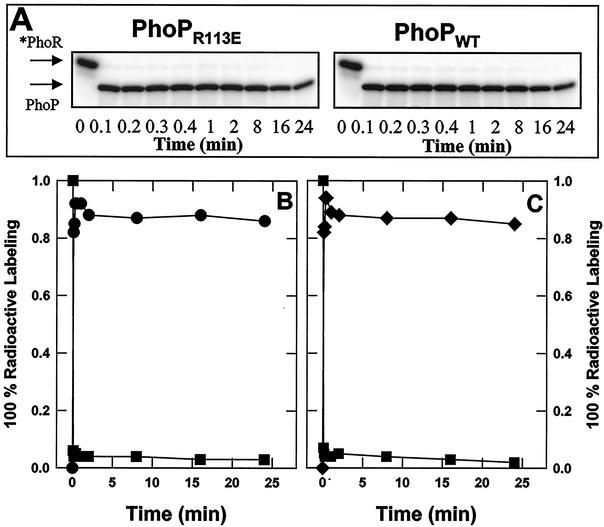
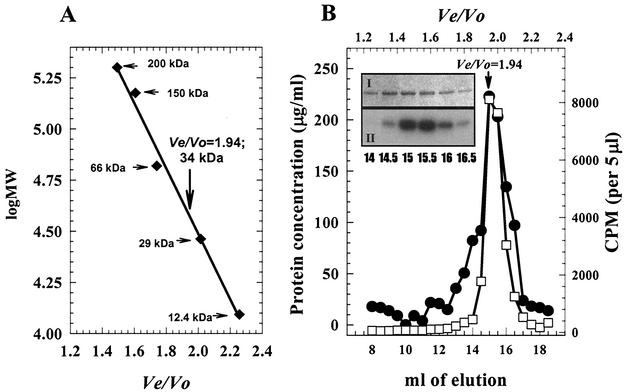
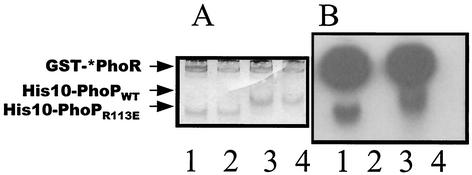
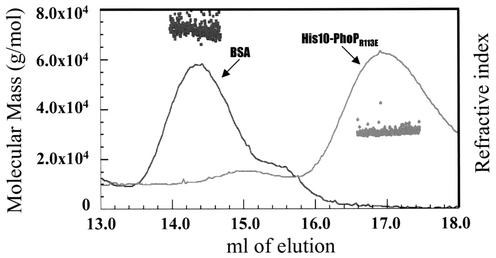
Bacillus subtilis PhoP is a member of the OmpR/PhoB family of response regulators that is directly required for transcriptional activation or repression of Pho regulon genes in conditions under which P(i) is growth limiting. Characterization of the PhoP protein has established that phosphorylation of the protein is not essential for PhoP dimerization or DNA binding but is essential for transcriptional regulation of Pho regulon genes. DNA footprinting studies of PhoP-regulated promoters showed that there was cooperative binding between PhoP dimers at PhoP-activated promoters and/or extensive PhoP oligomerization 3' of PhoP-binding consensus repeats in PhoP-repressed promoters. The crystal structure of PhoPN described in the accompanying paper revealed that the dimer interface between two PhoP monomers involves nonidentical surfaces such that each monomer in a dimer retains a second surface that is available for further oligomerization. A salt bridge between R113 on one monomer and D60 on another monomer was judged to be of major importance in the protein-protein interaction. We describe the consequences of mutation of the PhoP R113 codon to a glutamate or alanine codon and mutation of the PhoP D60 codon to a lysine codon. In vivo expression of either PhoP(R113E), PhoP(R113A), or PhoP(D60K) resulted in a Pho-negative phenotype. In vitro analysis showed that PhoP(R113E) was phosphorylated by PhoR (the cognate histidine kinase) but was unable to dimerize. Monomeric PhoP(R113E) approximately P was deficient in DNA binding, contributing to the PhoP(R113E) in vivo Pho-negative phenotype. While previous studies emphasized that phosphorylation was essential for PhoP function, data reported here indicate that phosphorylation is not sufficient as PhoP dimerization or oligomerization is also essential. Our data support the physiological relevance of the residues of the asymmetric dimer interface in PhoP dimerization and function.


Figures

FIG. 1.
FIG. 1.
Salt bridge interaction (dotted lines) between D60 and R113 in the PhoPN dimer interface. Each protomer is represented by ribbons, and the color varies from light blue (N terminus) to purple (C terminus). α helixes are labeled. Red atoms, oxygen; blue atoms, nitrogen.
FIG. 2.
FIG. 2.
Chromosomal structure of the phoPR locus in various B. subtilis strains: phoPR loci in wild-type strain JH642 (A), phoPR-negative strain MH5913 (B), and IPTG-inducible phoPR wild-type and phoPR113 mutant strains (C). phoPR or portions of phoPR genes are indicated by thick solid arrows. Other chromosomal genes (mdh and polA) are indicated by thick gray arrows. pDH88 vector genes are indicated by thick gray arrows with windowpanes. The Tetr insertion into the phoPR EcoRI deletion is indicated by a cross-hatched box. pCH24 used for Campbell insertion-duplication in MH5913 is also shown. The dotted arrows indicate promoters. An asterisk indicates the site of amino acid codon replacement in PhoP (R113E, R113A, and D60K in MH6102, MH6103, and MH6104, respectively).
FIG. 3.
FIG. 3.
Growth of and APase production by B. subtilis strains MH5913, MH6101, MH6102, MH6103 and MH6104 cultured for 12 h in LPDM. The strains used are indicated in the panels. Symbols: ▴, cell growth of JH642 (wild-type control); ▵, APase specific activity of JH642; ⧫, cell growth with 1 mM IPTG; ▪, cell growth without IPTG; ◊, APase production with 1 mM IPTG; □, APase production without IPTG. The error bars indicate standard deviations for duplicates in at least three independent growth or APase experiments. OD540nm, optical density at 540 nm.
FIG. 4.
FIG. 4.
Western immunoblot detection of PhoP protein from B. subtilis strains. The cells were grown for 11 h and collected by centrifugation, and soluble proteins were extracted as described in Materials and Methods. The same amount (26 μg) of protein for each sample was separated by SDS-PAGE, transferred onto a polyvinylidene fluoride membrane, and immunodetected by using anti-PhoPC polyclonal sera. The migration position of purified PhoPWT (50 ng) used as a control is indicated by an arrow. Lane 1, MH5913; lane 2, JH642; lanes 3 and 7, MH6101; lanes 4 and 8, MH6102; lanes 5 and 9, MH6103; lanes 6 and 10, MH6104; lanes 3, 4, 5, and 6, with induction; lanes 7, 8, 9, and 10, without IPTG.
FIG. 5.
FIG. 5.
Purification of overexpressed His10-PhoPR113E from E. coli. Each purification step was analyzed by SDS-PAGE, and the gel was stained with Biosafe Coomassie blue (Bio-Rad). Lane 1, prestained protein standards; lane 2, supernatant fraction (20 μg); lane 3, nonbinding fractions from Ni-NTA chromatography; lane 4, eluate of His10-PhoPR113E from 30 to 300 mM imidazole gradient (10 μg); lane 5, gel filtration-purified His10-PhoPR113E (8 μg). The molecular masses of protein markers (lane 1) are indicated on the left.
FIG. 6.
FIG. 6.
Phosphotransfer rates from *PhoR∼P to PhoPR113E and PhoPWT are similar. GST-*PhoR was phosphorylated by incubating it with [γ-32P]ATP and was bound to glutathione-agarose. After excess [γ-32P]ATP was removed, 10 U of thrombin was added to the beads and mixed at room temperature for 20 min. The PhoR∼P was separated from the beads and mixed with an equimolar amount of PhoPR113E or PhoPWT. Samples having the same volume were removed from each reaction mixture at different times, as indicated, and the reaction was stopped with SDS loading buffer. Samples were then subjected to SDS-PAGE. The gels were dried, and the radioactivity was quantified with a PhosphorImager. Phosphorylated protein contents were expressed in arbitrary units. (A) Radioactivity in SDS-PAGE profile. The migration positions of *PhoR∼P and PhoP∼P are indicated by arrows. (B) *PhoR∼P incubated with PhoPR113E. (C) *PhoR∼P incubated with PhoPWT. Symbols: ▪, *PhoR∼P; •, PhoPR113E∼P; ⧫, PhoPWT∼P.
FIG. 7.
FIG. 7.
Determination of the molecular masses of His10-PhoPR113E and His10-PhoPR113E∼P by gel filtration. (A) Protein molecular standard curve, on which the elution position of His10-PhoPR113E is indicated by a vertical arrow. The horizontal arrows indicate the positions of molecular mass standards. (B) Elution profile for His10-PhoP R113E∼P on a Superdex 200 column. Symbols: •, protein concentration; □, radioactive counts. (Inset) SDS-PAGE profile of protein peak fraction. Panel I, Biosafe Coomassie blue stain; panel II, radioactivity. Ten microliters of each fraction indicated was used for SDS-PAGE.
FIG. 8.
FIG. 8.
Biosafe Coomassie blue staining (A) and radioactivity (B) of native PAGE gel. The positions of GST-*PhoR, His10-PhoPWT, and His10-PhoPR113E are indicated on the left. GST-*PhoR and His10-PhoPR113E or His10-PhoPWT (1 μg each) were mixed with or without 10 μCi of [γ-32P]ATP in phosphorylation buffer. After incubation at room temperature for 20 min, the mixture was loaded onto the native gel. Lanes 1, GST-*PhoR with His10-PhoPR113E in the presence of [γ-32P]ATP; lanes 2, GST-*PhoR with His10-PhoPR113E; lanes 3, GST-*PhoR with His10-PhoPWT in the presence of [γ-32P]ATP; lanes 4, GST-*PhoR with His10-PhoPWT.
FIG. 9.
FIG. 9.
Molecular mass of His10-PhoPR113E. His10-PhoPR113E or BSA was injected into a TSK G3000SW column. The refractive index signals (PhoPR113E or BSA) are displayed along with the molecular mass (•, PhoP; ▪, BSA) calculated for each successive 0.25 s along the peak.
FIG. 10.
FIG. 10.
Gelshift assays of the pstS promoter bound by PhoP∼P, PhoP, PhoPR113E∼P, or PhoPR113E. The 364-bp pstS promoter was incubated with PhoP (A) or PhoPR113E (B) and GST-*PhoR in the presence or absence of ATP. The concentrations of PhoP and PhoPR113E used in the reactions are indicated above the lanes. Each reaction mixture contained 1 μM GST-*PhoR.

Similar articles

Cited by

References

    1. Antelmann, H., C. Scharf, and M. Hecker. 2000. Phosphate starvation-inducible proteins of Bacillus subtilis: proteomics approach and transcriptional analysis. J. Bacteriol. 182:4478-4490. - PMC - PubMed
    1. Arantes, O., and D. Lereclus. 1991. Construction of cloning vectors for Bacillus thuringiensis. Gene 108:115-119. - PubMed
    1. Birck, C., Y. Chen, F. M. Hulett, and J.-P. Samama. 2003. The crystal structure of the regulatory domain in PhoP reveals a functional tandem association mediated by an asymmetric interface. J. Bacteriol. 185:254-261. - PMC - PubMed
    1. Birck, C., L. Mourey, P. Gouet, B. Fabry, J. Schumacher, P. Rousseau, D. Kahn, and J. P. Samama. 1999. Conformational changes induced by phosphorylation of the FixJ receiver domain. Structure Fold Des. 7:1505-1515. - PubMed
    1. Birkey, S. M., W. Liu, X. Zhang, M. F. Duggan, and F. M. Hulett. 1998. Pho signal transduction network reveals direct transcriptional regulation of one two-component system by another two-component regulator: Bacillus subtilis PhoP directly regulates production of ResD. Mol. Microbiol. 30:943-953. - PubMed

Publication types

LinkOut - more resources