. 2002 Dec 16;196(12):1593-604.
doi: 10.1084/jem.20020515.

Sustained activation of Lyn tyrosine kinase in vivo leads to autoimmunity

Affiliations

Sustained activation of Lyn tyrosine kinase in vivo leads to autoimmunity

Margaret L Hibbs et al. J Exp Med. .

Abstract

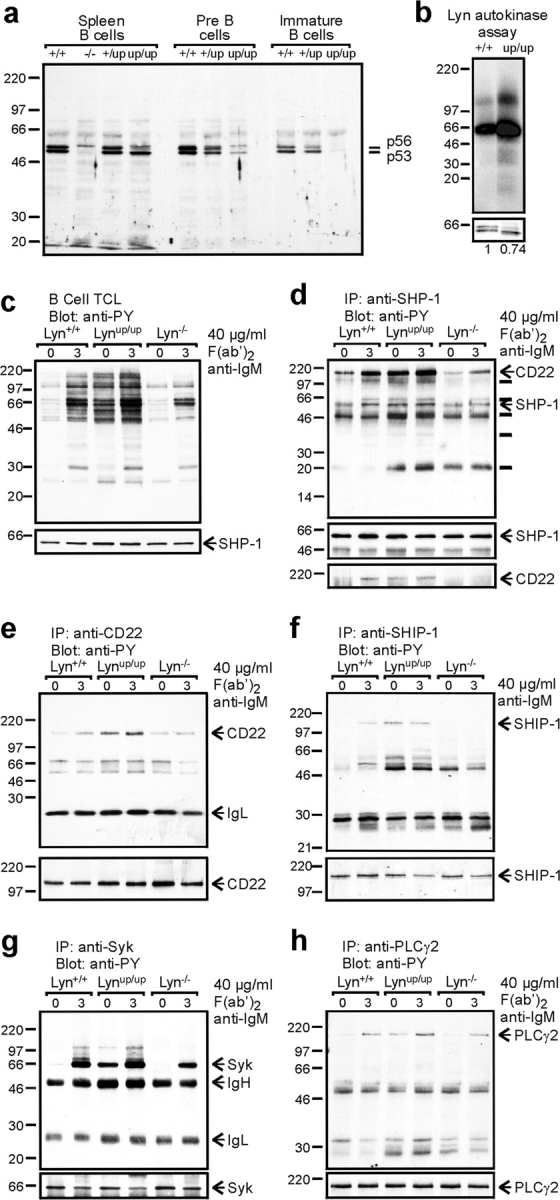
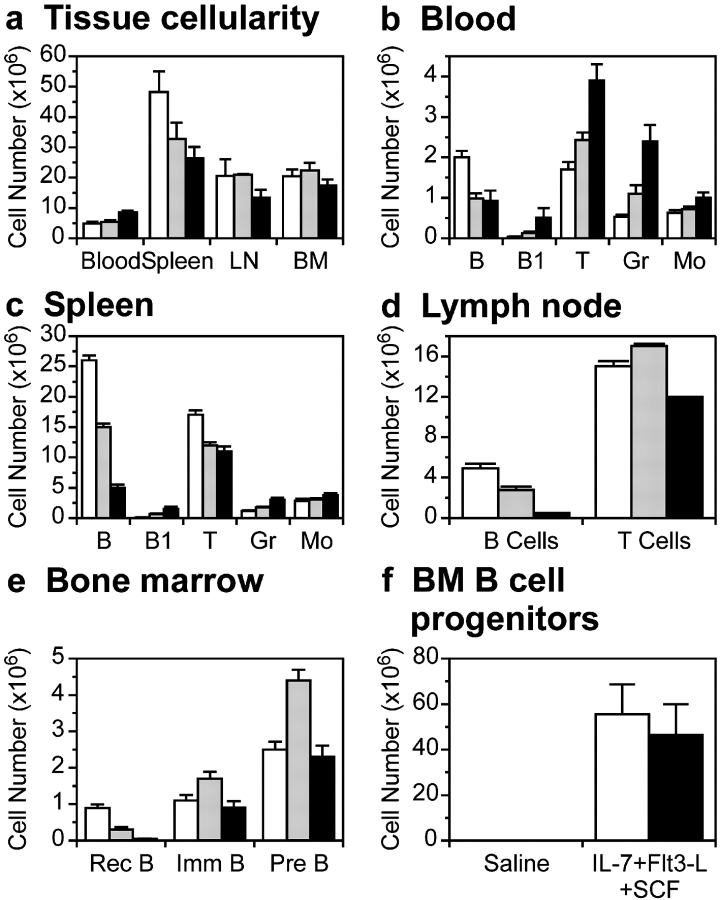
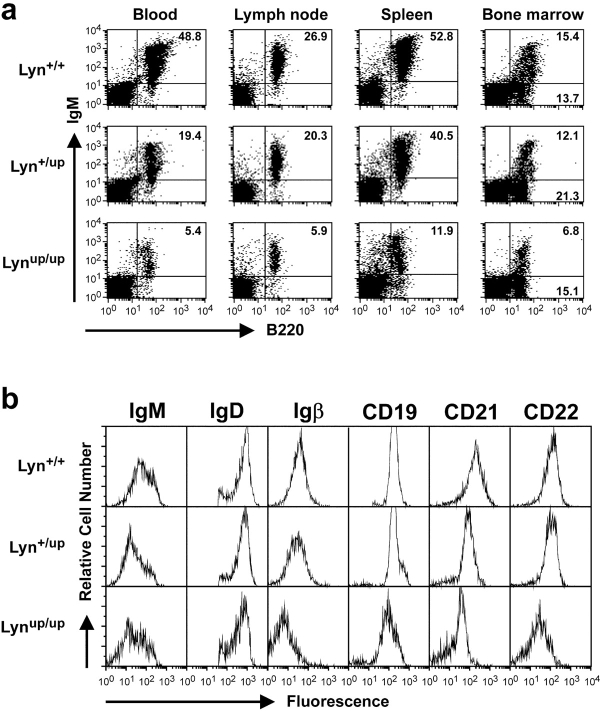
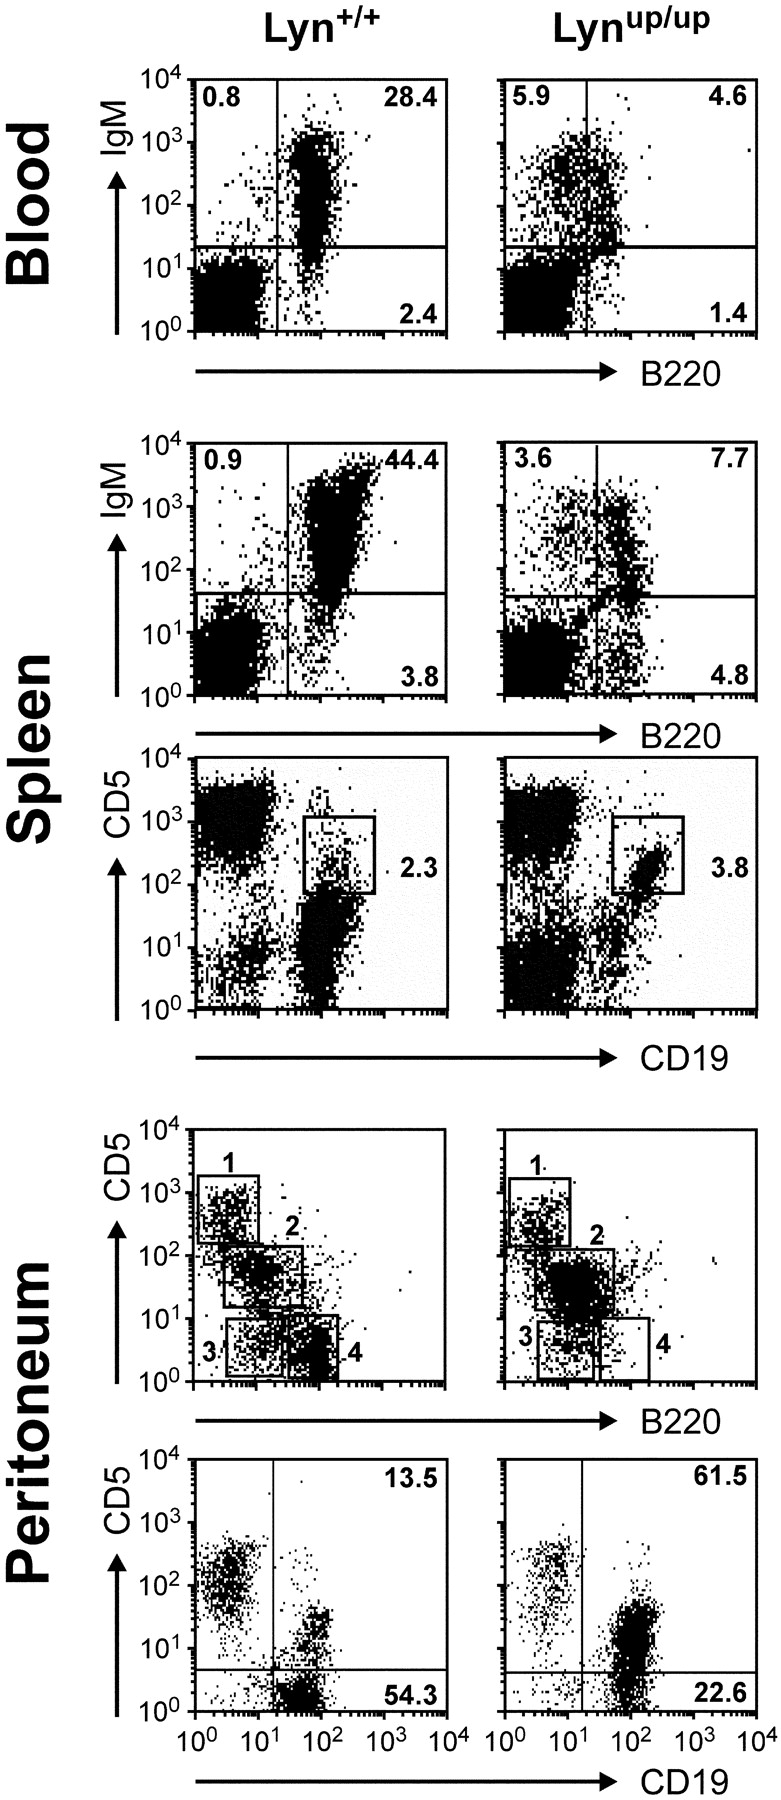
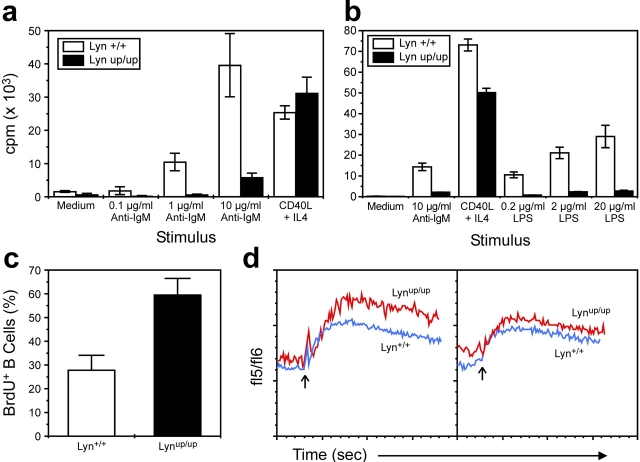
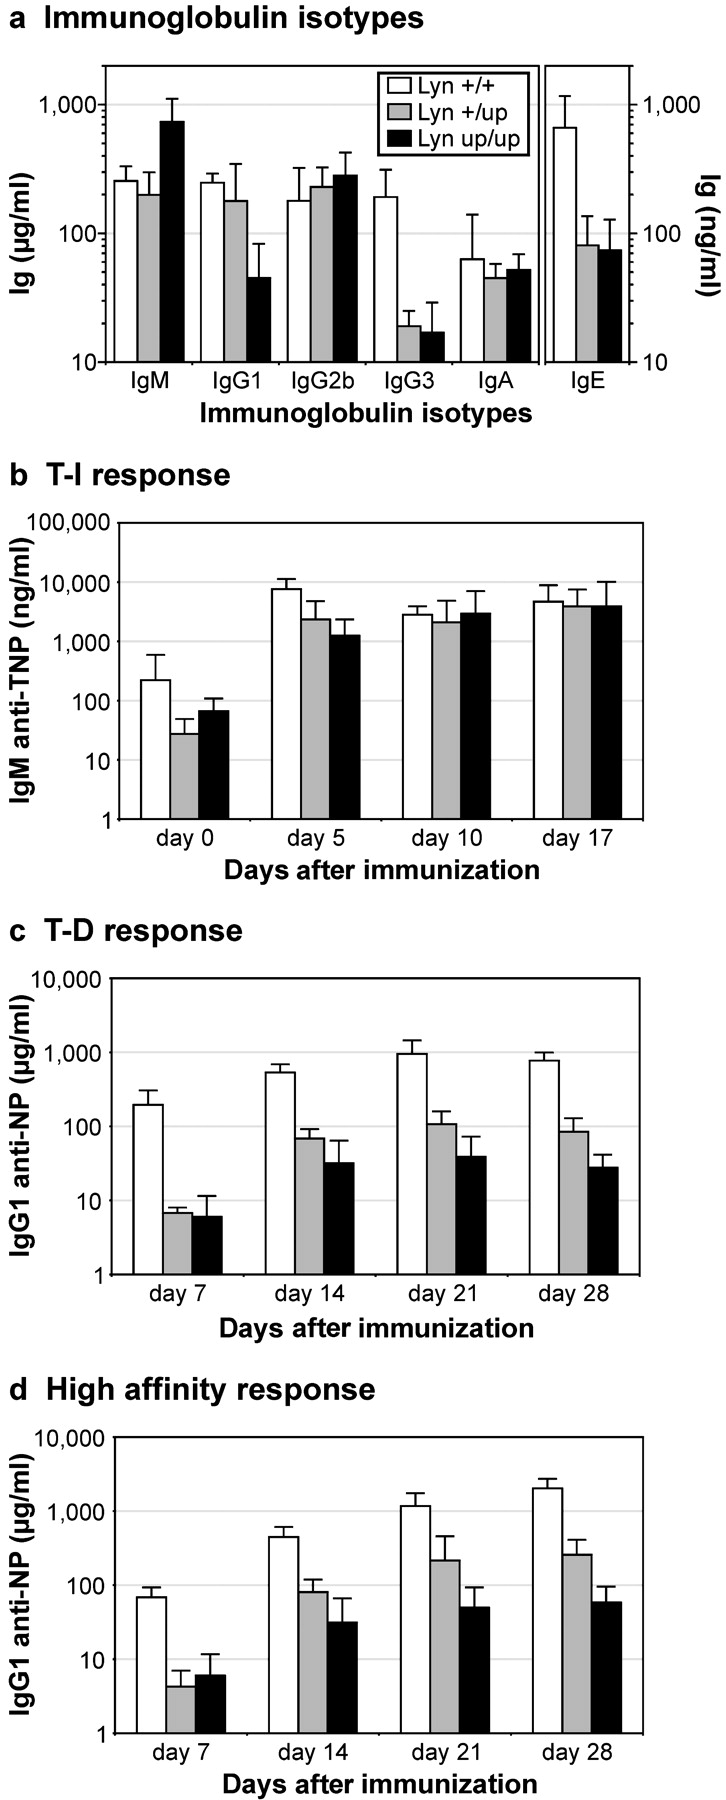
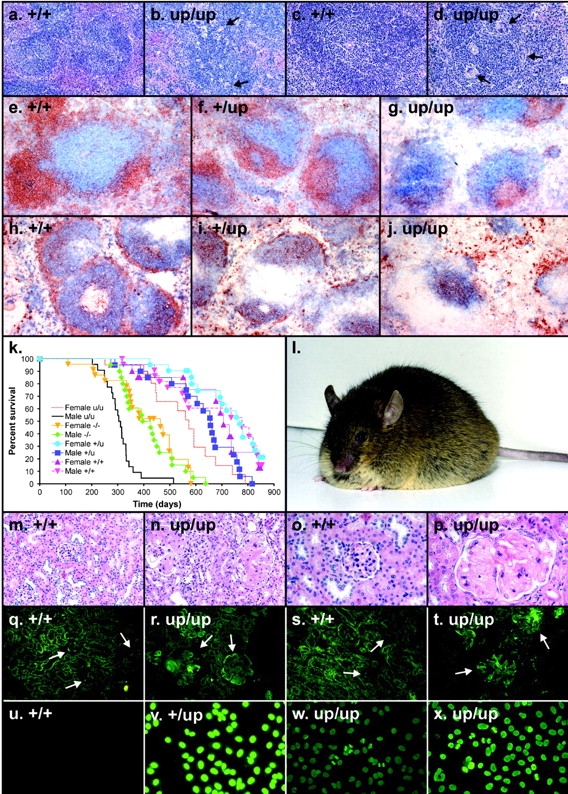
Genetic ablation of the Lyn tyrosine kinase has revealed unique inhibitory roles in B lymphocyte signaling. We now report the consequences of sustained activation of Lyn in vivo using a targeted gain-of-function mutation (Lyn(up/up) mice). Lyn(up/up) mice have reduced numbers of conventional B lymphocytes, down-regulated surface immunoglobulin M and costimulatory molecules, and elevated numbers of B1a B cells. Lyn(up/up) B cells are characterized by the constitutive phosphorylation of negative regulators of B cell antigen receptor (BCR) signaling including CD22, SHP-1, and SHIP-1, and display attributes of lymphocytes rendered tolerant by constitutive engagement of the antigen receptor. However, exaggerated positive signaling is also apparent as evidenced by the constitutive phosphorylation of Syk and phospholipase Cgamma2 in resting Lyn(up/up) B cells. Similarly, Lyn(up/up) B cells show a heightened calcium flux in response to BCR stimulation. Surprisingly, Lyn(up/up) mice develop circulating autoreactive antibodies and lethal autoimmune glomerulonephritis, suggesting that enhanced positive signaling eventually overrides constitutive negative signaling. These studies highlight the difficulty in maintaining tolerance in the face of chronic stimulation and emphasize the pivotal role of Lyn in B cell signaling.


Figures

Figure 1.
Figure 1.
Altered Lyn protein levels and signaling in primary B cells from Lyn mutant mice. (a) Mature B cells were purified from the spleen (Spleen B cells) and Pre-B and immature B cells were purified from the BM of the indicated mice (+/+, Lyn+/+; −/−, Lyn−/−; +/up, Lyn+/up; up/up, Lynup/up) by FACS® sorting. Total cell lysates (TCL; 5 × 10⁶ cell equivalents for mature and Pre-B cells and 2.5 × 10⁶ cell equivalents for immature B cells) were immunoblotted with anti-Lyn Abs. The p56 and p53 isoforms of Lyn are indicated. (b) Lyn kinase activity. Equalized levels of Lyn protein (bottom, including densitometric measurements) immunoprecipitated from Lyn+/+ (+/+) and Lynup/up (up/up) B cells were subjected to autokinase reactions. (c) Primary B cells from Lyn+/+, Lynup/up, and Lyn−/− mice were stimulated for 0 or 3 min with 40 μg/ml F(ab′)2 anti-IgM. 25 μg TCLs were immunoblotted with anti-PY. The blot was stripped and reprobed with anti–SHP-1 as a protein loading control. (d) SHP-1 was immunoprecipitated from the indicated B cell lysates and immunoblotted with anti-PY. The blot was stripped and reprobed with anti–SHP-1 (middle) and an antiserum to CD22 (bottom) to demonstrate coassociation of SHP-1 and phospho-CD22. CD22 (e), SHIP-1 (f), Syk (g), and PLCγ2 (h) were immunoprecipitated from the indicated B cell lysates and immunoblotted with anti-PY. Blots were stripped and re-probed with the indicated antibodies to ensure equal protein loading.
Figure 2.
Figure 2.
Cellularity and composition of lymphoid tissue in 8-wk-old Lyn+/+, Lyn+/up, and Lynup/up mice. (a) Nucleated cells in lymphoid tissue in Lyn+/+, Lyn+/up, and Lynup/up mice. Numbers represent per ml blood, per whole spleen, per mesenteric lymph nodes, and per femur. (b) Numbers of conventional B cells, B1 cells, T cells, granulocytes (Gr), and monocytes (Mo) in blood and (c) spleen of Lyn+/+, Lyn+/up, and Lynup/up mice. (d) Numbers of B and T cells in mesenteric lymph nodes of Lyn+/+, Lyn+/up, and Lynup/up mice. (e) Numbers of recirculating B cells (Rec B), immature B cells (Imm B), and Pre-B cells in the BM of Lyn+/+, Lyn+/up, and Lynup/up mice. Data in a–e is compiled from nine mice in three experiments, except B cell and B1 cell numbers in blood and spleen, which were compiled from six mice in two experiments. Data is mean ± standard error. (f) BM B cell progenitors in Lyn+/+ and Lynup/up mice. Numbers are the mean ± standard deviation for five mice of each genotype. For a–f, white bars, Lyn+/+; gray bars, Lyn+/up; black bars, Lynup/up.
Figure 3.
Figure 3.
Lynup/up mice have reduced levels of recirculating B cells. (a) Representative two-color fluorescence analysis of lymphoid tissues from 8-wk-old Lyn+/+, Lyn+/up, and Lynup/up mice. Staining was performed with Abs against B220 and IgM to determine proportions of B cells and levels of surface IgM. The mean fluorescence intensity of IgM on peripheral blood B cells from Lyn+/+, Lyn+/up, and Lynup/up mice is 163, 101, and 103, respectively, on lymph node B cells is 300, 163, and 213, respectively, and on splenic B cells is 196, 122, and 133, respectively. (b) Representative single-color FACS® analysis of splenic B220+ cells from 8-wk-old Lyn+/+, Lyn+/up, and Lynup/up mice. Staining was performed with Abs against the indicated cell surface molecules to assess expression level.
Figure 4.
Figure 4.
Lynup/up mice have increased numbers of B1 cells. Two-color fluorescence analysis of blood, spleen, and peritoneal lymphoid cells from 8-wk-old Lyn+/+ and Lynup/up mice. Blood and spleen cells were stained with B220 and IgM to identify IgM+ B220lo B1 cells. Spleen cells were also stained with CD19 and CD5 Abs to show CD19hi CD5+ B1a cells in Lynup/up spleen (boxed region). Peritoneal cells were stained using Abs to B220 and CD5 to identify: Region 1, T cells (Lyn+/+, 14.4%; Lynup/up, 13.0%), Region 2, B1a B cells (Lyn+/+, 34.6%; Lynup/up, 76.1%), Region 3, B1b B cells (Lyn+/+, 9.4%; Lynup/up, 4.3%), and Region 4, B2 cells (Lyn+/+, 31.7%; Lynup/up, 1.8%). Alternatively, peritoneal B1a cells were revealed with Abs to CD19 and CD5.
Figure 5.
Figure 5.
Proliferation, turnover, and calcium responses of Lyn+/+ and Lynup/up B lymphocytes. 5 × 10⁴ FACS®-sorted splenic B cells from Lyn+/+ mice (open bars) and Lynup/up mice (solid bars) were cultured in the presence of (a) the indicated concentrations of anti-IgM or CD40 ligand plus interleukin-4 for 2 d, and in (b) the indicated concentrations of LPS, 10 μg/ml anti-IgM, or CD40 ligand plus interleukin-4 for 3 d. (c) Turnover of peripheral B lymphocytes by incorporation of BrdU. Spleen cells from BrdU-treated Lyn+/+ mice (open bars) and Lynup/up mice (solid bars) were stained for surface CD19 and intranuclear BrdU to determine the percentage of BrdU+ B cells. Data is representative of two experiments in which five mice of each genotype were analyzed. (d) Changes in [Ca2+]i induced by cross-linking surface IgM on Indo-1–loaded spleen cells from Lyn+/+ and Lynup/up mice. The fluorescence ratio of the cells (fl5/fl6) was measured by flow cytometry and B cells were identified by counter-staining with anti-B220. Cross-linking reagent was added at 60 s (arrow) and the measurement continued for 300 s Two representative examples from three experiments involving six mice of each genotype are shown with the response of Lyn+/+ B cells depicted in blue and Lynup/up B cells in red.
Figure 6.
Figure 6.
Immunoglobulin levels and immune responses. (a) Levels of immunoglobulin isotypes in the serum of 8–20 unchallenged Lyn+/+, Lyn+/up, and Lynup/up mice. (b) Specific IgM response of a group of six Lyn+/+, Lyn+/up, and Lynup/up mice at the indicated times after immunization with 10 μg DNP-dextran. Data is representative of two experiments. (c) Specific IgG1 response of a group of six Lyn+/+, Lyn+/up, and Lynup/up mice at the indicated times after immunization with 100 μg NP-KLH. Data is representative of two experiments. (d) High affinity IgG1 response of the group of mice indicated in c. Data is representative of two experiments. Data are mean ± standard deviation. For a–d, white bars, Lyn+/+; gray bars, Lyn+/up; black bars, Lynup/up.
Figure 7.
Figure 7.
Histology, immunohistochemistry, survival, autoantibodies, and immunofluorescence analysis of Lyn+/+ and Lyn mutant mice. (a) Spleen from a Lyn+/+ mouse showing lymphoid follicles with germinal centers. (b) Spleen from a Lynup/up mouse showing lymphoid follicles with numerous multinucleate giant cells (arrows). (c) Higher power view of Lyn+/+ spleen. (d) Higher power view of Lynup/up spleen depicting multinucleate giant cells within a lymphoid follicle (arrows). Spleen sections from (e) Lyn+/+, (f) Lyn+/up, and (g) Lynup/up mice stained with B220 and CD3 to detect B (brown) and T cells (blue). Spleen sections from (h) Lyn+/+, (i) Lyn+/up, and (j) Lynup/up mice stained with IgM (brown) and IgD (blue) to detect marginal zones (IgMhi). (k) Kaplan-Meier survival curve showing the percent survival of a cohort of 20 male and 20 female Lyn+/+, Lyn+/up, Lynup/up, and Lyn−/− mice. (l) Male Lynup/up mouse of 10 mo of age showing extensive edema. (m) Low power view of a renal cortex from a Lyn+/+ mouse showing several normal glomeruli. (n) Low power view of Lynup/up renal cortex showing two very enlarged sclerotic glomeruli. (o) High power view of Lyn+/+ renal cortex showing a normal glomerulus. (p) High power view of Lynup/up renal cortex showing a severely damaged glomerulus with lobularity and sclerosis. View of the renal cortex from (q) Lyn+/+ and (r) Lynup/up mice stained with anti-Ig. Glomeruli are indicated with arrows. View of the renal cortex from (s) Lyn+/+ and (t) Lynup/up mice stained with anti-IgG. Glomeruli are indicated with arrows. Immunofluorescence analysis of HEp-2 cells stained with antisera from (u) female Lyn+/+, (v) male Lyn+/up, (w) female Lynup/up, and (x) male Lynup/up mice.

Similar articles

Cited by

References

    1. Healy, J.I., and C.C. Goodnow. 1998. Positive versus negative signaling by lymphocyte antigen receptors. Annu. Rev. Immunol. 16:645–670. - PubMed
    1. O'Keefe, T.L., G.T. Williams, S.L. Davies, and M.S. Neuberger. 1996. Hyperresponsive B cells in CD22-deficient mice. Science. 274:798–801. - PubMed
    1. Sato, S., A.S. Miller, M. Inaoki, C.B. Bock, P.J. Jansen, M.L. Tang, and T.F. Tedder. 1996. CD22 is both a positive and negative regulator of B-lymphocyte antigen receptor signal transduction: altered signaling in CD22-deficient mice. Immunity. 5:551–562. - PubMed
    1. Otipoby, K.L., K.B. Andersson, K.E. Draves, S.J. Klaus, A.G. Garr, J.D. Kerner, R.M. Perlmutter, C.-L. Law, and E.A. Clark. 1996. CD22 regulates thymus independent responses and the lifespan of B cells. Nature. 384:634–637. - PubMed
    1. Nitschke, L., R. Carsetti, B. Ocker, G. Kohler, and M.C. Lamers. 1997. CD22 is a negative regulator of B cell receptor signaling. Curr. Biol. 7:133–143. - PubMed

Publication types

MeSH terms