. 2002 Dec 23;159(6):923-9.
doi: 10.1083/jcb.200207071. Epub 2002 Dec 16.

Mitochondrial release of apoptosis-inducing factor occurs downstream of cytochrome c release in response to several proapoptotic stimuli

Affiliations

Mitochondrial release of apoptosis-inducing factor occurs downstream of cytochrome c release in response to several proapoptotic stimuli

Damien Arnoult et al. J Cell Biol. .

Abstract

Mitochondrial outer membrane permeabilization by proapoptotic Bcl-2 family proteins, such as Bax, plays a crucial role in apoptosis induction. However, whether this only causes the intracytosolic release of inducers of caspase-dependent death, such as cytochrome c, or also of caspase-independent death, such as apoptosis-inducing factor (AIF) remains unknown. Here, we show that on isolated mitochondria, Bax causes the release of cytochrome c, but not of AIF, and the association of AIF with the mitochondrial inner membrane provides a simple explanation for its lack of release upon Bax-mediated outer membrane permeabilization. In cells overexpressing Bax or treated either with the Bax- or Bak-dependent proapoptotic drugs staurosporine or actinomycin D, or with hydrogen peroxide, caspase inhibitors did not affect the intracytosolic translocation of cytochrome c, but prevented that of AIF. These results provide a paradigm for mitochondria-dependent death pathways in which AIF cannot substitute for caspase executioners because its intracytosolic release occurs downstream of that of cytochrome c.


Figures

Figure 1.
Figure 1.
Oligomeric Bax, Bax/tBid oligomers, and tBid induce the release of cytochrome c, but not of AIF from isolated mitochondria. (A) Mitochondria isolated from HeLa cells were incubated for 30 min at 30°C with different concentrations (nM) of recombinant oligomeric Bax. Mitochondrial pellets and supernatant fractions were separated by SDS-PAGE, and their respective contents in AIF and cytochrome c (Cyt c) analyzed by Western blotting. (B) Mitochondria isolated from HeLa cells were incubated with 200 nM oligomeric recombinant Bax or with control buffer (none) at 30°C, and the mitochondria pellet and supernatant were analyzed at different time points (min), as in A. Asterisk in A and B indicates an additional band. (C) Mitochondria freshly isolated from rat liver cells were incubated for 15 min in the absence or presence of 100 nM recombinant monomeric Bax and/or 10 nM recombinant tBid, and analyzed as in A. (D) Mitochondria freshly isolated from rat liver cells were incubated for 30 min in the absence or presence of 50 or 100 nM recombinant tBid, and analyzed as in C. In all experiments, equal loading of the mitochondrial pellet was controlled using an mAb against either VDAC or cytochrome c oxidase subunit IV (Cox IV).
Figure 2.
Figure 2.
AIF is associated with the mitochondrial inner membrane. (A) Rat liver cell mitochondria (M), mitoplasts (Mp), mitochondrial inner membrane (MIM), and mitochondrial outer membrane (MOM), were resolved by SDS-PAGE, and their respective contents in AIF, cytochrome c (Cyt.c), Cox IV, and VDAC were analyzed by Western blotting. (B) Mp (that consists of the MIM and matrix) were further treated with 0.1 M sodium carbonate (Na2CO3), pH 11.5, for 30 min on ice and pelleted by centrifugation. VDAC, an integral component of MOM, is present in M and MOM, but also detectable at low levels in Mp and MIM, as VDAC is present at MIM/MOM junctions that seem unaffected by treatments used to separate MIM and MOM. Because at equal protein concentrations, MOM are enriched for VDAC, there is less VDAC in M than in MOM. Cox IV, an integral component of MIM, is present in M, Mp, and enriched in MIM, but lacking in MOM, and remains in Mp after Na2CO3 treatment.
Figure 3.
Figure 3.
Caspase inhibitors prevent mitochondrial release of AIF in Bax-overexpressing cells. (A) Western blot analysis of AIF and cytochrome c (Cyt c) release in the cytosolic fraction, and of Bax expression, caspase-9 (Casp-9), and caspase-3 (Casp-3) processing and PARP cleavage in total cell extracts (total) at various time points after transient transfection of 293T cells with either a vector encoding HA-Bax (Bax) or the empty control vector (vector), in the absence (−) or presence (+) of the caspase inhibitor z-VAD-fmk (100 μM). Actin was used as loading control. Asterisk indicates the HA-Bax, the NH2-terminal HA-tag providing an additional molecular mass of ∼1.5 kD. (B) The cytosolic fraction of Bax transfected 293 T cells in the absence or presence of the caspase inhibitor BAF (100 μM) was analyzed by Western blotting for cytochrome c (Cyt c) and AIF release, as in A. (C) GFP-Bax expression, and immunostaining of Hsp60, cytochrome c (Cyt c), and AIF together with nuclear Hoechst staining in HeLa cells 18 h after transient transfection with a vector encoding GFP-Bax in the absence (−zVAD-fmk) or presence (+zVAD-fmk) of the caspase inhibitor z-VAD-fmk (100 μM). Nuclear staining by the polyclonal anti-AIF antibody is nonspecific, and also induced by control sera (not depicted). (D) Quantitative analysis of the numbers of GFP-Bax–transfected cells with intracytosolic release of cytochrome c and/or AIF in the absence or presence of 100 μM z-VAD-fmk. Each histogram indicates mean ± SD of three fields of at least 100 cells within a representative experiment.
Figure 3.
Figure 3.
Caspase inhibitors prevent mitochondrial release of AIF in Bax-overexpressing cells. (A) Western blot analysis of AIF and cytochrome c (Cyt c) release in the cytosolic fraction, and of Bax expression, caspase-9 (Casp-9), and caspase-3 (Casp-3) processing and PARP cleavage in total cell extracts (total) at various time points after transient transfection of 293T cells with either a vector encoding HA-Bax (Bax) or the empty control vector (vector), in the absence (−) or presence (+) of the caspase inhibitor z-VAD-fmk (100 μM). Actin was used as loading control. Asterisk indicates the HA-Bax, the NH2-terminal HA-tag providing an additional molecular mass of ∼1.5 kD. (B) The cytosolic fraction of Bax transfected 293 T cells in the absence or presence of the caspase inhibitor BAF (100 μM) was analyzed by Western blotting for cytochrome c (Cyt c) and AIF release, as in A. (C) GFP-Bax expression, and immunostaining of Hsp60, cytochrome c (Cyt c), and AIF together with nuclear Hoechst staining in HeLa cells 18 h after transient transfection with a vector encoding GFP-Bax in the absence (−zVAD-fmk) or presence (+zVAD-fmk) of the caspase inhibitor z-VAD-fmk (100 μM). Nuclear staining by the polyclonal anti-AIF antibody is nonspecific, and also induced by control sera (not depicted). (D) Quantitative analysis of the numbers of GFP-Bax–transfected cells with intracytosolic release of cytochrome c and/or AIF in the absence or presence of 100 μM z-VAD-fmk. Each histogram indicates mean ± SD of three fields of at least 100 cells within a representative experiment.
Figure 4.
Figure 4.
Caspase inhibitor prevents mitochondrial release of AIF in cells treated with proapoptotic drugs. (A) Percentages of cells with apoptotic nuclei (% of apoptotic nuclei) was determined as indicated in Materials and methods in HeLa cells treated for 9 h with 2 μM staurosporine in the absence or presence of 100 μM z-VAD-fmk. (B) Total extract of the these cells was analyzed by Western blotting for cas- pase-9 (casp-9) and caspase-3 (casp-3) processing and PARP cleavage. (C) Cytosolic fraction and heavy membrane fraction from these cells was analyzed by Western blotting for the presence of cytochrome c (Cyt c) and AIF. As control for loading, actin was used in the cytosolic fraction and Cox IV in the heavy membrane fraction. (D) HeLa cells were either left untreated or treated for 9 h with 10 μM actinomycin D in the presence or absence of 100 μM z-VAD-fmk, then cytosolic fraction and heavy membrane fraction were analyzed as in C. (E) The cells were also immunostained with the anti–cytochrome c (Cyt c) and anti-AIF antibodies together with Hoechst nuclear staining. (F) Quantitative analysis of the numbers of actinomycin D–treated cells with intracytosolic release of cytochrome c and/or AIF in the absence or presence of 100 μM z-VAD-fmk. Each histogram indicates mean ± SD of three fields of at least 100 cells within a representative experiment. (G) HeLa cells were transiently transfected for 18 h with a vector encoding full length AIF, and then either left untreated (Control) or treated for 9 h with 10 μM actinomycin D in the presence or absence of 100 μM z-VAD-fmk, and then immunostained with the anti–cytochrome c (Cyt c) and anti-AIF antibodies together with Hoechst nuclear staining. Arrows in E and G indicate cells showing intracytosolic release of cytochrome c.
Figure 4.
Figure 4.
Caspase inhibitor prevents mitochondrial release of AIF in cells treated with proapoptotic drugs. (A) Percentages of cells with apoptotic nuclei (% of apoptotic nuclei) was determined as indicated in Materials and methods in HeLa cells treated for 9 h with 2 μM staurosporine in the absence or presence of 100 μM z-VAD-fmk. (B) Total extract of the these cells was analyzed by Western blotting for cas- pase-9 (casp-9) and caspase-3 (casp-3) processing and PARP cleavage. (C) Cytosolic fraction and heavy membrane fraction from these cells was analyzed by Western blotting for the presence of cytochrome c (Cyt c) and AIF. As control for loading, actin was used in the cytosolic fraction and Cox IV in the heavy membrane fraction. (D) HeLa cells were either left untreated or treated for 9 h with 10 μM actinomycin D in the presence or absence of 100 μM z-VAD-fmk, then cytosolic fraction and heavy membrane fraction were analyzed as in C. (E) The cells were also immunostained with the anti–cytochrome c (Cyt c) and anti-AIF antibodies together with Hoechst nuclear staining. (F) Quantitative analysis of the numbers of actinomycin D–treated cells with intracytosolic release of cytochrome c and/or AIF in the absence or presence of 100 μM z-VAD-fmk. Each histogram indicates mean ± SD of three fields of at least 100 cells within a representative experiment. (G) HeLa cells were transiently transfected for 18 h with a vector encoding full length AIF, and then either left untreated (Control) or treated for 9 h with 10 μM actinomycin D in the presence or absence of 100 μM z-VAD-fmk, and then immunostained with the anti–cytochrome c (Cyt c) and anti-AIF antibodies together with Hoechst nuclear staining. Arrows in E and G indicate cells showing intracytosolic release of cytochrome c.
Figure 5.
Figure 5.
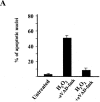
AIF release is caspase dependent in H 2 O 2 -mediated cell death. (A) Percentages of apoptotic nuclei were determined in HeLa cells treated for 6 h with 400 μM H2O2 in the absence or presence of 100 μM z-VAD-fmk. (B) HeLa cells were treated as in A and immunostained with a sheep anti–cytochrome c (Cyt c) and a mouse anti-AIF mAb together with Hoechst nuclear staining. (C) Quantitative analysis of the numbers of H2O2-treated cells with intracytosolic release of cytochrome c and/or AIF in the absence or presence of 100 μM z-VAD-fmk. Each histogram indicates mean ± SD of three fields of at least 100 cells within a representative experiment.
Figure 5.
Figure 5.
AIF release is caspase dependent in H 2 O 2 -mediated cell death. (A) Percentages of apoptotic nuclei were determined in HeLa cells treated for 6 h with 400 μM H2O2 in the absence or presence of 100 μM z-VAD-fmk. (B) HeLa cells were treated as in A and immunostained with a sheep anti–cytochrome c (Cyt c) and a mouse anti-AIF mAb together with Hoechst nuclear staining. (C) Quantitative analysis of the numbers of H2O2-treated cells with intracytosolic release of cytochrome c and/or AIF in the absence or presence of 100 μM z-VAD-fmk. Each histogram indicates mean ± SD of three fields of at least 100 cells within a representative experiment.

References

    1. Antonsson, B., S. Montessuit, S. Lauper, R. Eskes, and J.C. Martinou. 2000. Bax oligomerization is required for channel-forming activity in liposomes and to trigger cytochrome c release from mitochondria. Biochem. J. 345:271–278. - PMC - PubMed
    1. Desagher, S., A. Osen-Sand, A. Nichols, R. Eskes, S. Montessuit, S. Lauper, K. Maundrell, B. Antonsson, and J.C. Martinou. 1999. Bid induced conformational change of Bax is responsible for mitochondrial cytochrome c release during apoptosis. J. Cell Biol. 144:891–901. - PMC - PubMed
    1. Eskes, R., B. Antonsson, A. Osen-Sand, S. Montessuit, C. Richter, R. Sadoul, G. Mazzei, A. Nichols, and J.C. Martinou. 1998. Bax-induced cytochrome C release from mitochondria is independent of the permeability transition pore but highly dependent on Mg2+ ions. J. Cell Biol. 143:217–224. - PMC - PubMed
    1. Evan, G., and T. Littlewood. 1998. A matter of life and death. Science. 281:1317–1322. - PubMed
    1. Finucane, D.M., E. Bossy-Wetzel, N.J. Waterhouse, T.G.G. Cotter, and D.R. Green. 1999. Bax-induced caspase activation and apoptosis via cytochrome c release from mitochondria is inhibitable by Bcl-xL. J. Biol. Chem. 274:2225–2233. - PubMed

Publication types

MeSH terms