. 2002 Dec 15;22(24):10558-66.
doi: 10.1523/JNEUROSCI.22-24-10558.2002.

Electrical synapses mediate signal transmission in the rod pathway of the mammalian retina

Affiliations

Electrical synapses mediate signal transmission in the rod pathway of the mammalian retina

Margaret Lin Veruki et al. J Neurosci. .

Abstract

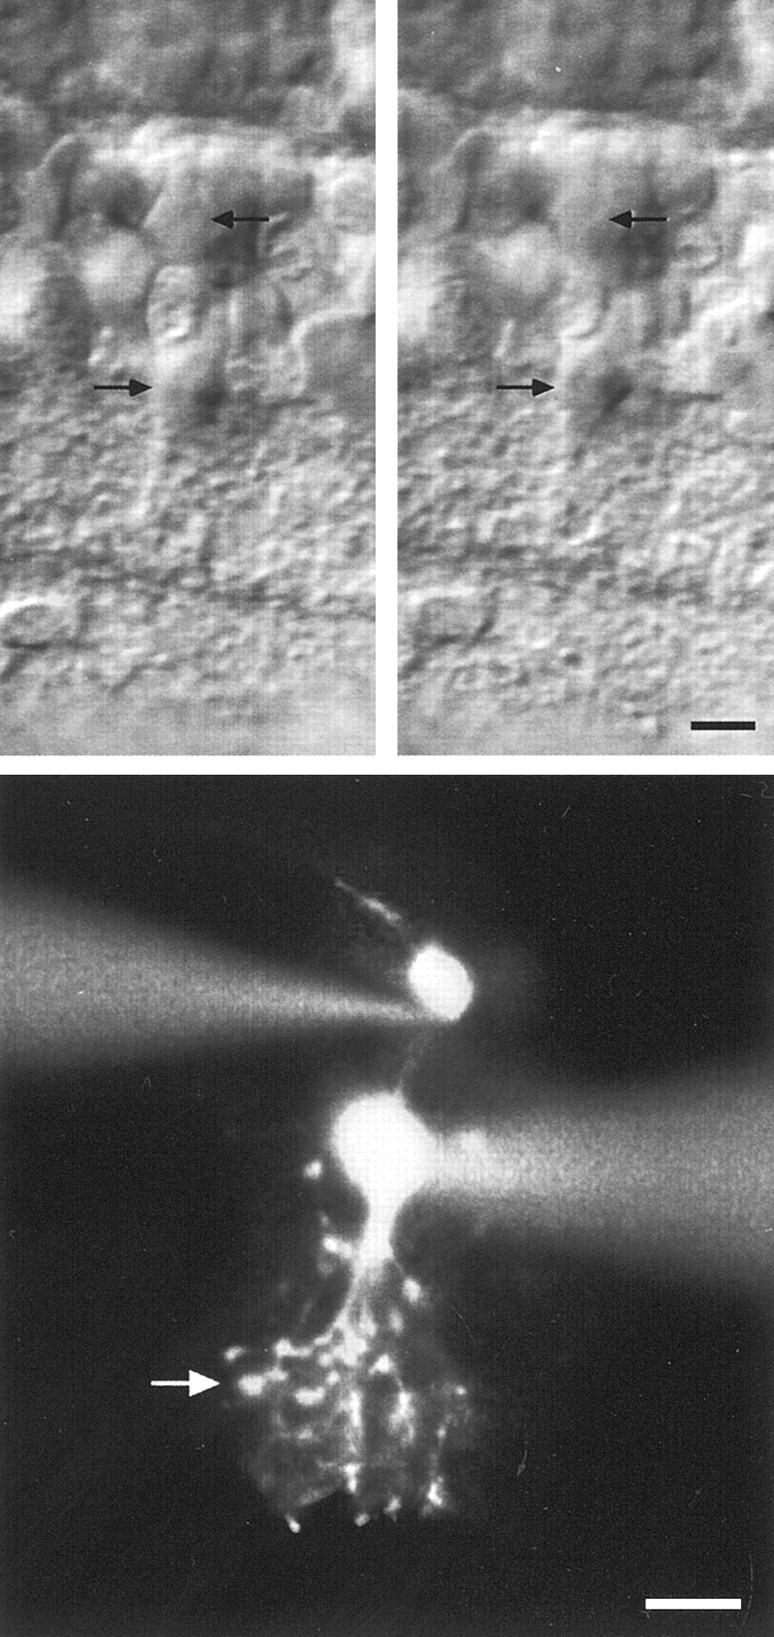
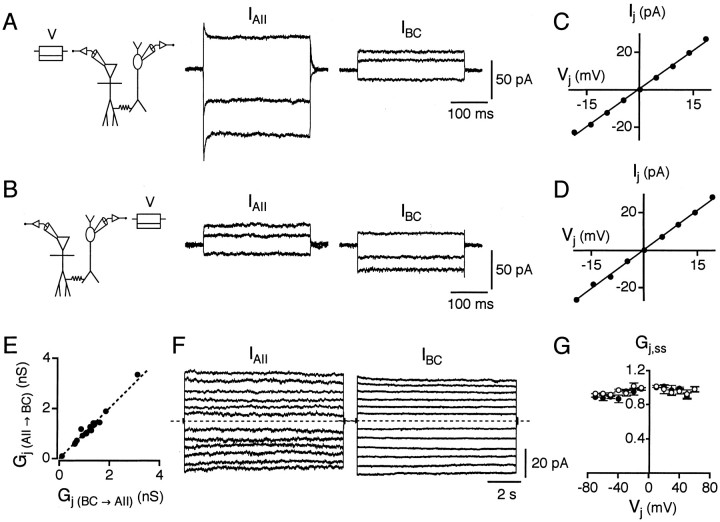
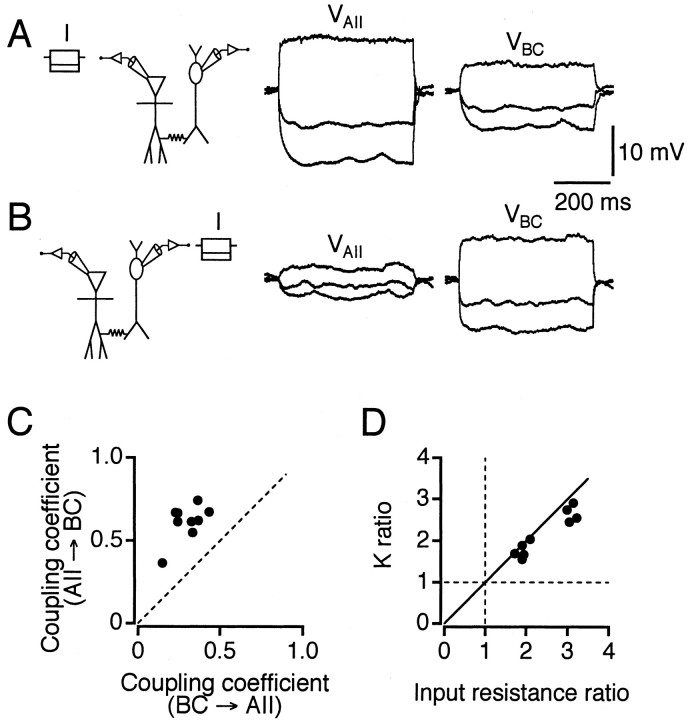
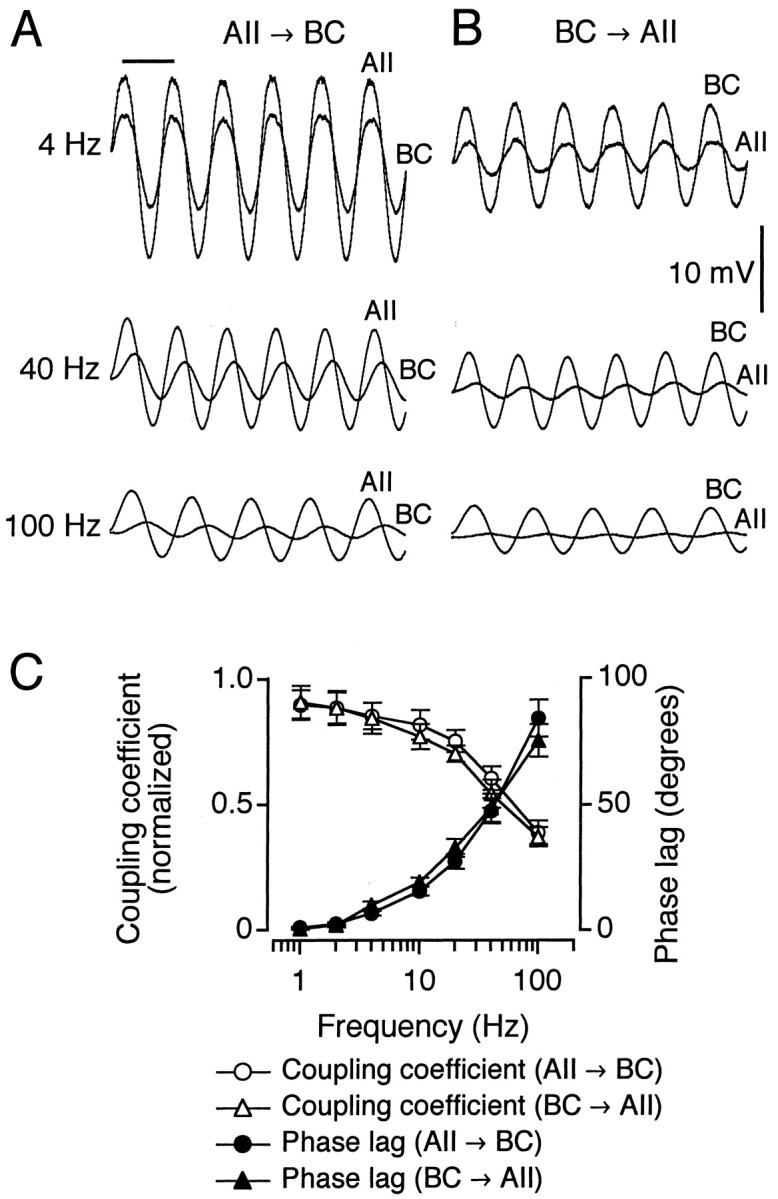
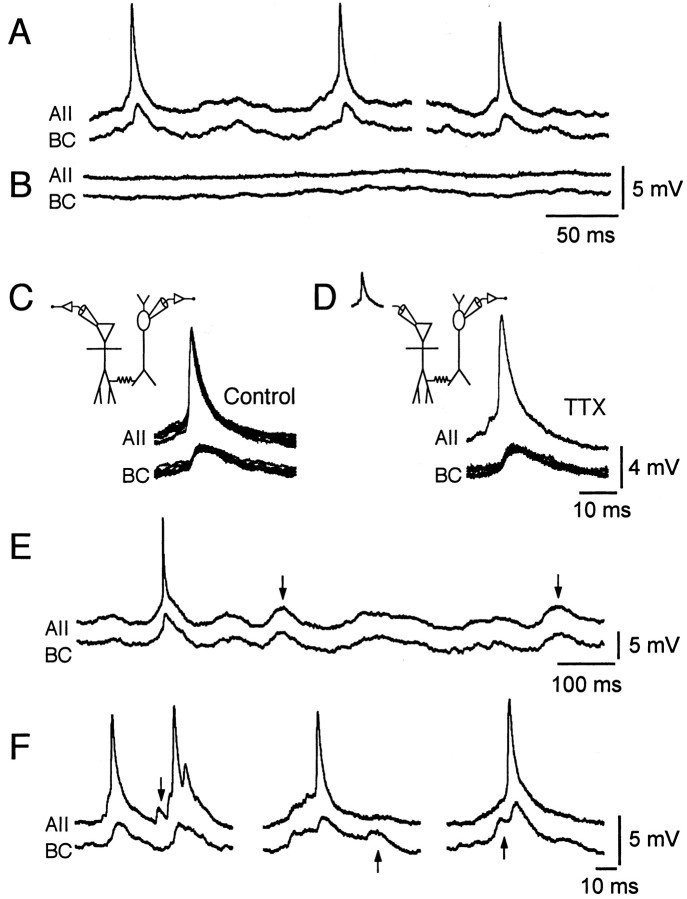
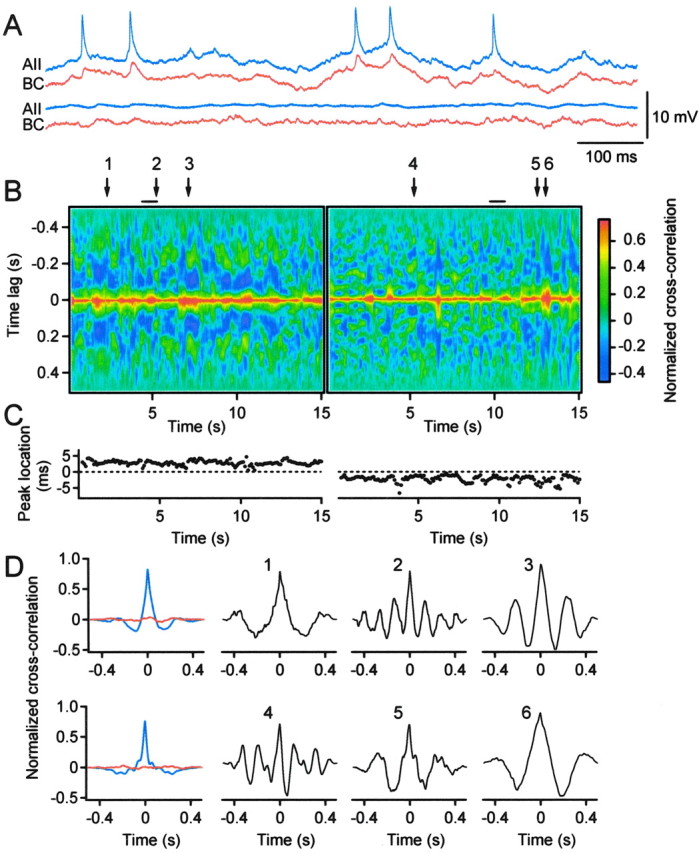
In the retina, AII (rod) amacrine cells are essential for integrating rod signals into the cone pathway. In addition to being interconnected via homologous gap junctions, these cells make extensive heterologous gap junctions with ON-cone bipolar cells (BCs). These gap junctions are the pathway for transfer of rod signals to the ON-system. To investigate the functional properties of these gap junctions, we performed simultaneous whole-cell recordings from pairs of AII amacrine cells and ON-cone bipolar cells in the in vitro slice preparation of the rat retina. We demonstrate strong electrical coupling with symmetrical junction conductance (approximately 1.2 nS) and very low steady-state voltage sensitivity. However, signal transmission is more effective in the direction from AII amacrine cells to ON-cone bipolar cells than in the other direction. This functional rectification can be explained by a corresponding difference in membrane input resistance between the two cell types. Signal transmission has low-pass filter characteristics with increasing attenuation and phase shift for increasing stimulus frequency. Action potentials in AII amacrine cells evoke distinct electrical postsynaptic potentials in ON-cone bipolar cells. Strong and temporally precise synchronization of subthreshold membrane potential fluctuations are commonly observed.


Figures

Fig. 1.
Fig. 1.
Visualization of simultaneously recorded AII amacrine cells and ON-cone bipolar cells. Top two panels, An AII amacrine cell (bottom arrows) and a type 7 ON-cone bipolar cell (top arrows) in anin vitro slice from rat retina, visualized with infra-red differential interference contrast videomicroscopy. In theleftpanel, the ON-cone bipolar cell is in focus; in the rightpanel, the AII amacrine cell is in focus. Bottom, Composite fluorescence photomicrograph of same cell pair after filling with Lucifer yellow. The level of stratification of the axon terminal of the ON-cone bipolar cell is indicated by an arrow. Scale bars, 10 μm.
Fig. 2.
Fig. 2.
Junction conductance of electrical synapses between AII amacrine cells and ON-cone bipolar cells. A, With a cell pair in voltage clamp (Vh = −60 mV), 300 msec voltage pulses (V) of −20, −10, and +15 mV are applied to the AII amacrine cell while current responses are recorded from both cells (IAII andIBC). Hyperpolarizing pulses applied to the AII amacrine cell result in inward currents in this cell and outward currents in the bipolar cell (type 7). A depolarizing pulse in the AII amacrine cell results in an outward current in this cell and an inward current in the bipolar cell. Here and in subsequent figures, the recording configuration is drawn with the AII amacrine cell on theleft and the ON-cone bipolar cell on theright. B, Same as in A, but voltage pulses are applied to the bipolar cell (V). C, Current–voltage relationship for the junctional current (Ij) versus the junctional voltage (Vj) for cell pair inA and B; voltage pulses (from −20 to +20 mV, 5 mV increments) applied to AII amacrine cell (as inA). The data points have been fit with a straight line (slope = Gj). D,Same as in C, but voltage pulses applied to bipolar cell (as in B). E, Comparison ofGj in each direction indicates nonrectifying electrical coupling [Gj (BC AII) for bipolar cell presynaptic;Gj (AII BC) for AII amacrine cell presynaptic]. The dashed line has a slope of 1 [Gj (BCAII) = Gj (AII BC)]. F, Relaxation experiments to determine steady-state voltage sensitivity of electrical junction conductance between two coupled cells. Experimental paradigm as in A and B, but presynaptic voltage pulses are 10 sec in duration (−60 to +60 mV, 10 mV increments).Traces illustrate postsynaptic current responses (IAII) with voltage pulses applied to the bipolar cell (left, type 8) and postsynaptic current responses (IBC) with voltage pulses applied to the AII amacrine cell (right). Note that for larger amplitude voltage pulses, there is slight decay of postsynaptic currents toward a (non-zero) steady-state level. Dashed lines indicate baseline current. G, Plot of steady-state junctional conductance (Gj,ss) as a function ofVj. Gj,ss at eachVj is plotted as mean ± SEM. Data points are normalized to the instantaneous value at eachVj. Data for each direction of coupling are plotted separately, with either an AII amacrine cell (○) or a bipolar cell (●) postsynaptic.
Fig. 3.
Fig. 3.
Estimation of coupling coefficients between electrically coupled cells. A, With both cells in current clamp, 500 msec current pulses (I) of −50, −25, and +50 pA are applied to the AII amacrine cell while voltage responses are recorded from both cells (VAII,VBC). Injection of negative current results in hyperpolarization of both cells, and injection of positive current results in depolarization of both cells. B, Same as in A, but current pulses of −20, −10, and +20 pA are applied to the bipolar cell (type 6). C, Comparison of coupling coefficients in each direction indicates apparent rectification for all cell pairs (BCAII for bipolar cell presynaptic; AIIBC for AII amacrine cell presynaptic). Thestraight line has a slope of 1 (i.e., coupling coefficient is the same in both directions). D, Relation between apparent rectification (K ratio) and input resistance ratio. The continuous line represents the values expected when pairs of cells are connected by asymmetrical coupling coefficients and input resistances, but symmetricalGj. The horizontal andvertical dashed lines represent values expected when pairs of cells have identical coupling coefficients and input resistances, respectively.
Fig. 4.
Fig. 4.
Electrical coupling between AII amacrine cells and ON-cone bipolar cells displays transmission characteristics of a low-pass filter. A, B, Increasing phase lag and response attenuation between the voltage oscillations evoked in the presynaptic and postsynaptic cells of a coupled pair when injecting sinusoidal current stimuli of increasing frequency in the presynaptic cell. A, AII amacrine cell presynaptic (current stimulus 100 pA peak-to-peak amplitude) and bipolar cell (type 6) postsynaptic (each trace is the average of 3–9 sweeps). Horizontal calibration bar indicates duration of one stimulus period (250 msec for 4 Hz, 25 msec for 40 Hz, and 10 msec for 100 Hz; A,B). B, Same as in A, but bipolar cell presynaptic (current stimulus 30 pA peak-to-peak amplitude) and AII amacrine cell postsynaptic (eachtrace is the average of 3–9 sweeps). C, Bode plot showing frequency dependence of response attenuation (coupling coefficient normalized to steady-state coupling coefficient) and phase lag of sinusoidal voltage response for both directions of coupling (n = 6 cell pairs).
Fig. 5.
Fig. 5.
Transmission of action potentials from AII amacrine cells and electrical PSPs in ON-cone bipolar cells.A, Spontaneous activity of a simultaneously recorded, electrically coupled cell pair. Spikes in the AII amacrine cell occur together with slower depolarizations in the ON-cone bipolar cell (type 7). B, TTX blocks spiking in the AII amacrine cell and corresponding subthreshold depolarizations in the ON-cone bipolar cell.C, Left, Recording configuration, both cells in current clamp. Right, Overlaid spontaneous activity (Control) traces of AII amacrine cell and bipolar cell aligned by a spike in the AII amacrine cell (n = 6). Same cell pair as A.D, Left, Recording configuration; AII amacrine cell voltage clamped with prerecorded action potential waveform and bipolar cell in current clamp. Right, Overlaid evoked activity traces of AII amacrine cell and bipolar cell aligned by a simulated spike in the AII amacrine cell (n = 6); recorded in the presence of TTX. Same cell pair as A. E, Spontaneous activity of a simultaneously recorded, electrically coupled cell pair. Note simultaneously occurring subthreshold depolarizations (vertical arrows) in the AII amacrine cell and the bipolar cell (type 8), presumably evoked by spiking activity in other AII amacrine cells independently coupled to both cells. A spike in the AII amacrine cell evokes an additional subthreshold depolarization in the bipolar cell.F, Spontaneous activity of simultaneously recorded, electrically coupled cell pairs (left, type 6 bipolar cell; middle and right, type 7 bipolar cell, same cell pair). Note subthreshold depolarizations (vertical arrows) in the AII amacrine cell (left) or the bipolar cell (middle andright) unaccompanied by corresponding depolarizations in the other cell of the pair.
Fig. 6.
Fig. 6.
Synchronous subthreshold membrane potential fluctuations during spontaneous activity. A, Spontaneous activity of a pair of simultaneously recorded, electrically coupled cells (AII amacrine cell, blue; cone bipolar cell type 7, red) in control solution (top) and in the presence of antagonists of chemical synaptic transmission, TTX and Co2+ (bottom). B,Sliding 2D cross-correlograms for 15 sec continuous recordings of same cell pair as in A (left, control condition; right, with blockers). Horizontal axis, Time at the center of the 0.5 sec sliding window;vertical axis, time lag from the center (zero time delay) of the window. The normalized correlation amplitude is coded by color (bar, right). Period of recordings in A is indicated by solid horizontal lines. C, Location of peak amplitude in 2D cross-correlograms in B (left, control condition; right, with blockers). D, One-dimensional cross-correlograms (top row, control condition; bottom row, with blockers): time-averaged normal (blue) and shuffled (red) cross-correlograms (left); cross-correlograms centered at time points corresponding to arrows 1,2, and 3 in B (control condition); cross-correlograms centered at time points corresponding toarrows 4, 5, and 6 inB (with blockers).

Similar articles

Cited by

References

    1. Bennett MVL. Electrical transmission: a functional analysis and comparison to chemical transmission. In: Kandel ER, editor. The handbook of physiology: the nervous system, Vol I. American Physiological Society; Washington, DC: 1977. pp. 357–416.
    1. Bloomfield SA, Dacheux RF. Rod vision: pathways and processing in the mammalian retina. Prog Ret Eye Res. 2001;20:351–384. - PubMed
    1. Boos R, Schneider H, Wässle H. Voltage- and transmitter-gated currents of AII-amacrine cells in a slice preparation of the rat retina. J Neurosci. 1993;13:2874–2888. - PMC - PubMed
    1. Chun MH, Han SH, Chung JW, Wässle H. Electron microscopic analysis of the rod pathway of the rat retina. J Comp Neurol. 1993;332:421–432. - PubMed
    1. Euler T, Wässle H. Immunocytochemical identification of cone bipolar cells in the rat retina. J Comp Neurol. 1995;361:461–478. - PubMed

Publication types